. 2001 Apr 1;21(7):2195-205.
doi: 10.1523/JNEUROSCI.21-07-02195.2001.

Neurofilaments consist of distinct populations that can be distinguished by C-terminal phosphorylation, bundling, and axonal transport rate in growing axonal neurites

Affiliations

Neurofilaments consist of distinct populations that can be distinguished by C-terminal phosphorylation, bundling, and axonal transport rate in growing axonal neurites

J T Yabe et al. J Neurosci. .

Abstract

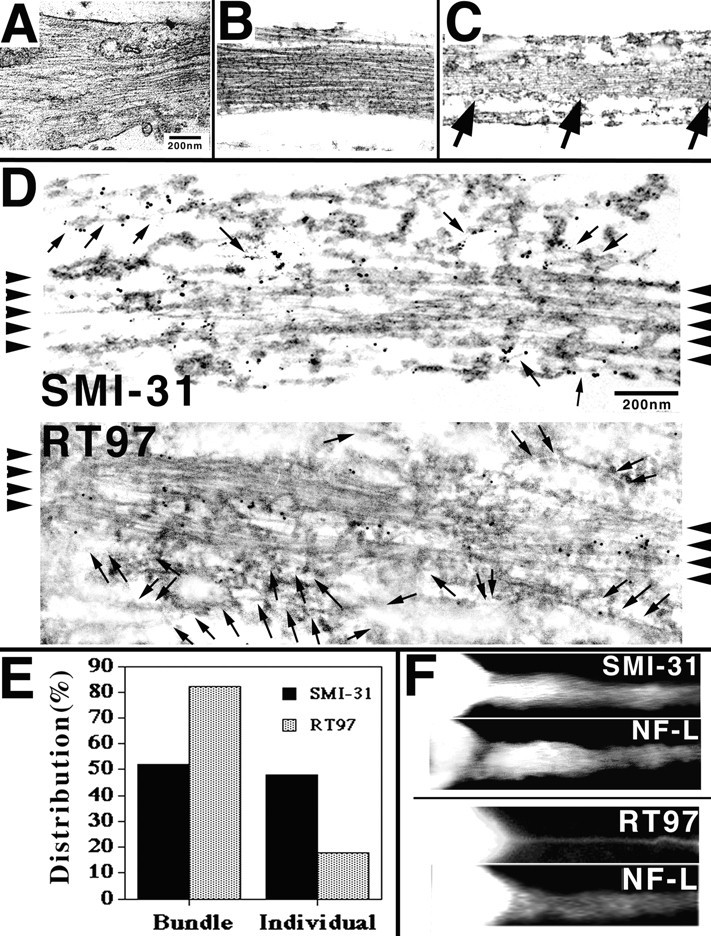
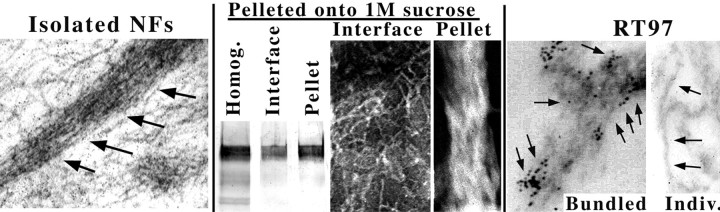
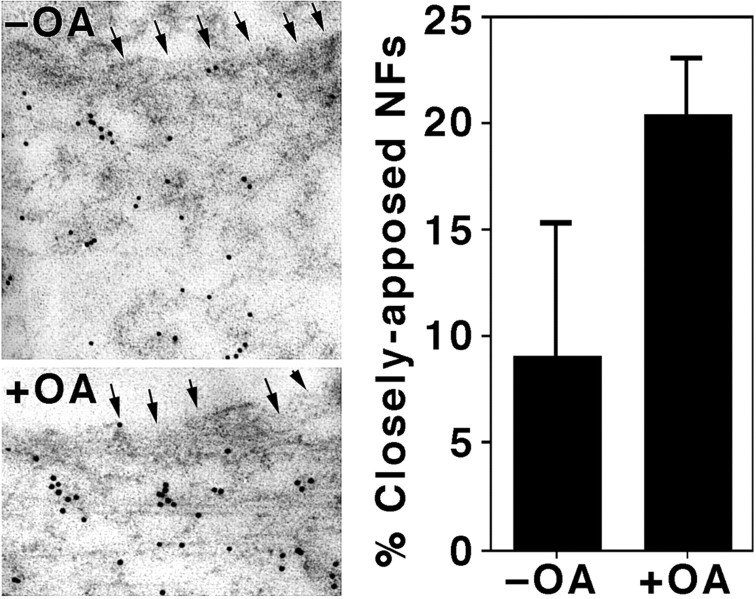
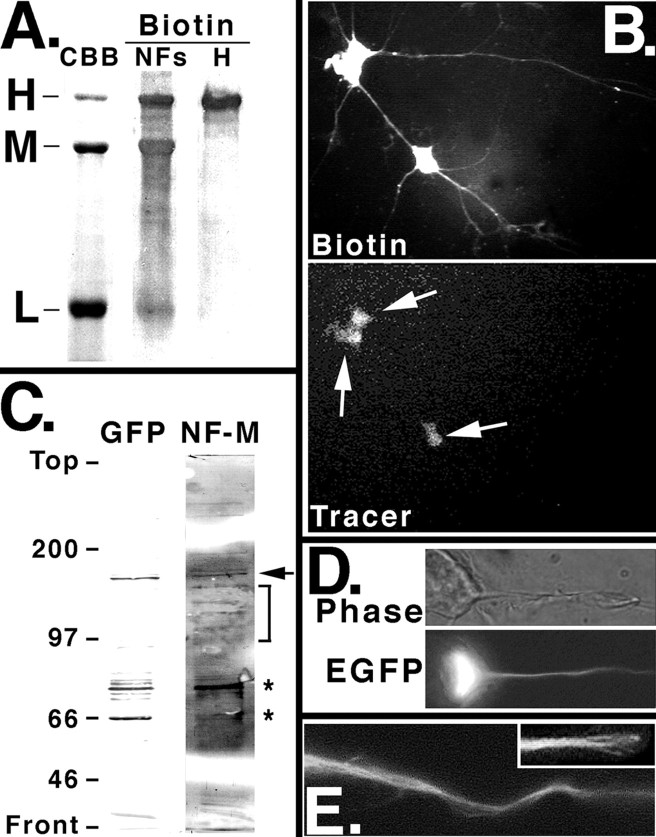
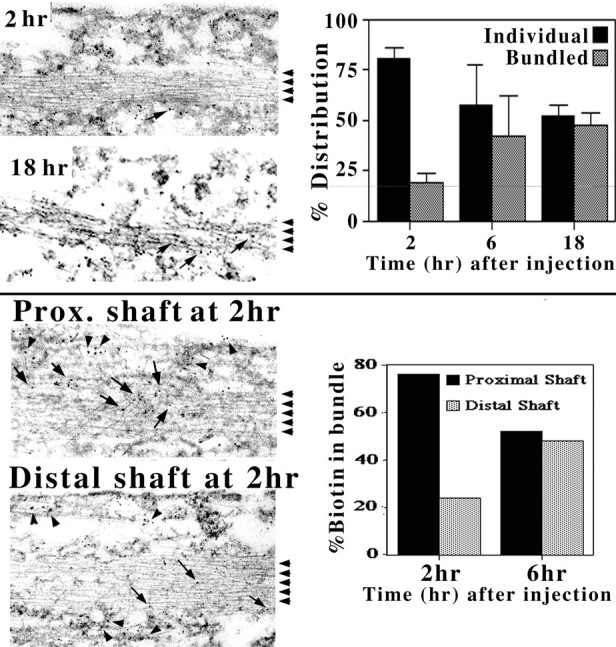
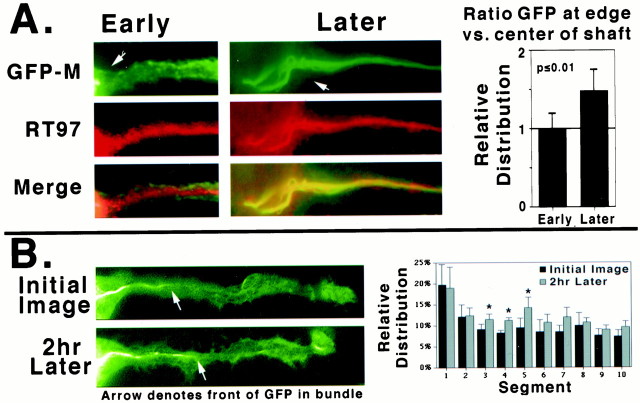
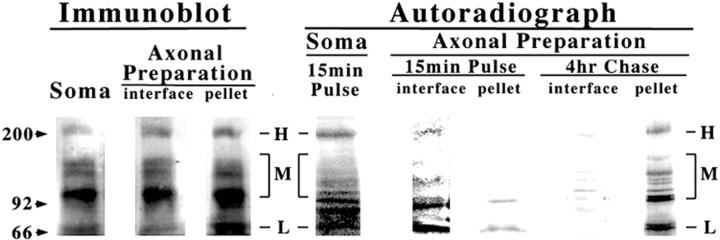
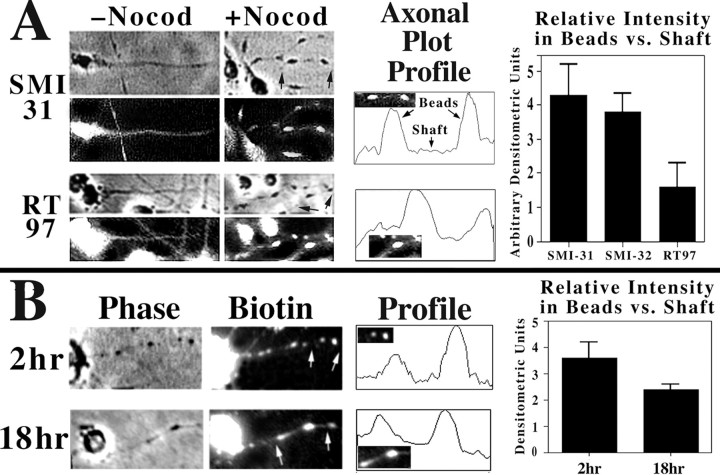
We examined the steady-state distribution and axonal transport of neurofilament (NF) subunits within growing axonal neurites of NB2a/d1 cells. Ultrastructural analyses demonstrated a longitudinally oriented "bundle" of closely apposed NFs that was surrounded by more widely spaced individual NFs. NF bundles were recovered during fractionation and could be isolated from individual NFs by sedimentation through sucrose. Immunoreactivity toward the restrictive C-terminal phospho-dependent antibody RT97 was significantly more prominent on bundled than on individual NFs. Microinjected biotinylated NF subunits, GFP-tagged NF subunits expressed after transfection, and radiolabeled endogenous subunits all associated with individual NFs before they associated with bundled NFs. Biotinylated and GFP-tagged NF subunits did not accumulate uniformly along bundled NFs; they initially appeared within the proximal portion of the NF bundle and only subsequently were observed along the entire length of bundled NFs. These findings demonstrate that axonal NFs are not homogeneous but, rather, consist of distinct populations. One of these is characterized by less extensive C-terminal phosphorylation and a relative lack of NF-NF interactions. The other is characterized by more extensive C-terminal NF phosphorylation and increased NF-NF interactions and either undergoes markedly slower axonal transport or does not transport and undergoes turnover via subunit and/or filament exchange with individual NFs. Inhibition of phosphatase activities increased NF-NF interactions within living cells. These findings collectively suggest that C-terminal phosphorylation and NF-NF interactions are responsible for slowing NF axonal transport.


Figures

Fig. 1.
Fig. 1.
NB2a/d1 axonal neurites contain a mixture of closely opposed and relatively disbursed NFs that exhibit differential reactivity toward phospho-dependent NF antibodies. A–C, Regions of axonal neurites of differentiated NB2a/d1 cells.A, B, Neurites fixed at 37°C under MT-stabilizing conditions in the absence (A) and presence (B) of 1% saponin (Shea, 1999). Note prominent MT profiles along the neurite. C, An axonal neurite extracted with 1% Triton X-100 at 4°C in the absence of MT-stabilizing agents. Note the centrally located “bundle” of closely apposed NFs (arrows) and the relative depletion of MTs. On the basis of these findings, all cultures for the remainder of this study were fixed at 4°C, with or without Triton X-100 and in the absence of taxol, to deplete axonal MTs and to reveal more clearly the Triton-insoluble NFs. A–C are presented at the same magnification. D, Axonal neurites of cells processed for immuno-EM with SMI-31 or RT97, as indicated, followed by colloidal gold-conjugated secondary antibody. C presents an axonal neurite, at smaller magnification, which also was processed for immuno-EM with SMI-31. Note that SMI-31 immunoreactivity is distributed among bundled and nonbundled individual NFs, whereas RT97 immunoreactivity is localized to bundled NFs. Arrows in the neurite that was reacted with SMI-31 denote individual NFs (peripheral to the bundle) that are decorated with colloidal gold, whereas arrows in the neurite reacted with RT97 denote individual NFs that are not decorated with colloidal gold.E, Quantification of the distribution of SMI-31 and RT97 immunoreactivity on bundled and peripherally located individual NFs. Note that the SMI-31 epitope is distributed relatively evenly between bundled and individual NFs, whereas the RT97 epitope is markedly more prevalent on bundled NFs. F, Double-immunofluorescent analyses of the distribution of SMI-31 and NF-L and, in a second cell, RT97 and NF-L. NF-L immunoreactivity is distributed evenly throughout axonal neurites. Note that, like NF-L immunoreactivity, SMI-31 immunoreactivity is distributed relatively evenly throughout axonal neurites. RT97 immunoreactivity, by contrast, is relatively concentrated along the center of the axon with respect to its longitudinal axis and does not codistribute with NF-L.
Fig. 2.
Fig. 2.
Some NFs are recovered from axonal neurites in bundled form. The panels present ultrastructural and immunological analyses of cytoskeletons. Bundled NFs were detected among individual NFs in sectioned cytoskeletal preparation (Isolated NFs). Negative stain analyses demonstrated that bundles sedimented via 1 m sucrose, whereas individual NFs did not (Pelleted onto 1 m sucrose); the accompanying immunoblots were processed for SMI-31 immunoreactivity, and the 200 kDa region is presented. Immuno-EM analyses demonstrated that RT97 immunoreactivity was associated selectively with bundled NFs in sectioned cytoskeletal preparations.
Fig. 3.
Fig. 3.
The phosphatase inhibitor okadaic acid (OA) increases NF–NF associations within axonal neurites. The panels present peripheral areas of axonal neurites from OA-treated and untreated cells that were probed with SMI-31, followed by colloidal gold-conjugated secondary antibody; the plasma membrane is noted by arrows. The accompanying graph presents quantification of the percentage of total SMI-31-immunoreactive filaments observed within 20 nm of another SMI-31-immunoreactive filament in longitudinally oriented sections. Note the more than twofold increase in closely apposed NFs after OA treatment (p < 0.05; Student's ttest).
Fig. 4.
Fig. 4.
Biotinylated and GFP-tagged NF subunits and their intracellular distribution after microinjection and transfection.A, Coomassie blue staining after SDS-gel electrophoresis of NFs isolated from bovine spinal cords (CBB) and immunoblot analysis of this preparation (NFs) after biotinylation and staining of chromatographically separated NF-H and NF-L, as indicated. B, UV images of cells 2 hr after the injection of biotinylated NF-H (Biotin) and fluorescein-conjugated tracer (Tracer), as indicated.C, Immunoblot analyses of Triton-insoluble cytoskeletons from cells stably transfected with the eGFP–NF-M construct. In addition to NF-M isoforms migrating between 97 and 145 kDa detected by anti-NF-M antibodies (bracket), note the presence of an NF-M-reactive isoform migrating at ∼170 kDa that also is detected by anti-GFP antibodies (arrow). Asterisksindicate lower-molecular-weight C-terminal proteolytic products derived from NF-M; note the labeling of these products by both GFP and NF-M antibodies. Identity of these species as breakdown products was confirmed by their increase at the expense of full-length eGFP–NF-M after the incubation of additional samples at room temperature for 30–60 min (data not shown). D, Fluorescent and corresponding phase-contrast image of an unextracted, transiently transfected cell. E, The axonal neurite of a transiently transfected cell processed under conditions that promote the splaying of axonal NFs (Brown, 1998). The resultant loosening of bundled NFs confirms the filamentous nature of axonal GFP fluorescence.Inset presents the distal region, just before the growth cone, of a second axonal neurite.
Fig. 5.
Fig. 5.
Ultrastructural analyses of the distribution of microinjected NF subunits. The panels present immuno-EM analyses of the distribution of biotinylated NF-H after its microinjection into differentiated NB2a/d1 cells, as described in Materials and Methods. Top, Biotinylated subunits (arrows) were readily localized along peripherally situated NFs within central axonal segments within 2 hr after injection but were excluded in large part from the bundle (indicated byarrowheads along the rightside of the micrographs). By 18 hr, however, biotinylated subunits were dispersed throughout the bundles. The accompanying graph presents the relative distribution of biotinylated NF-H subunits within individual and bundled NFs at 2, 6, and 18 hr after injection; note the progressive association of biotinylated subunits with bundled NFs. Bottom, Comparative analyses of the distribution of biotinylated N–H subunits within bundles and individual NFs within proximal and distal regions of the axonal shaft at 2 and 6 hr after microinjection; for these analyses we analyzed regions within the proximal and distal halves of the axonal shaft, excluding the hillock and the growth cone. Note the presence of some gold particles (arrows) within the centrally situated bundle (denoted by arrowheads alongrightside of the micrograph) within proximal segments at 2 hr after injection versus their absence in distal segments as well as in central segments (e.g., 2 hr micrograph in top panel). Note that not all NFs within bundles display even labeling within the proximal shaft at 2 hr; some NFs apparently remain unlabeled. The accompanying graph presents the relative distribution of biotinylated NF-H subunits within bundles in proximal and distal axonal shafts at 2 and 6 hr after injection; note that the vast majority of bundle-associated biotinylated subunits is localized within the proximal half of the axonal shaft at 2 hr after injection but is distributed equally between proximal and distal regions by 6 hr after injection.
Fig. 6.
Fig. 6.
GFP-tagged NF subunits exhibit a delayed association with bundled NFs. A, Images of cells transfected 16–24 hr previously with eGFP–NF-M and then fixed and immunostained with RT97. Arrowheads in the GFP images denote the neurite hillock. As described in Materials and Methods (see also Yabe et al., 1999), 16–24 hr of further incubation was required after transfection for the accumulation of sufficient eGFP-tagged NF-M for detection. Cells were fixed either as soon as GFP immunofluorescence was detected (Early) within axons or 2–4 hr later (Later). GFP fluorescence initially was observed along the periphery of axonal neurites and did not colocalize with RT97. Colocalization of GFP and RT97 is revealed byyellow-orange immunofluorescence in merged images. Note that GFP fluorescence initially is concentrated along the periphery of axonal neurites and does not exhibit appreciable colocalization with the centrally situated RT97-labeled bundle. By contrast, GFP fluorescence colocalizes with the RT97-labeled bundle 2 hr later. The accompanying graph presents the ratio of GFP within the center/on the periphery; data are pooled from multiple axons when GFP first was detected versus 2–4 hr later, as described in Materials and Methods. Note the significant increase in relative fluorescence within the center of the axon during this additional incubation. B, Fluorescent images of the same transfected cell taken 2 hr apart. Note in the initial image that NF subunits had distributed along the length of axonal neurite, yet relatively intense fluorescence within the central aspect of the axonal shaft was confined to the proximal-most region. An image of the same neurite 2 hr later revealed that this centrally located intense fluorescence extended more distally along the shaft (arrows). The accompanying graph presents compiled data that were obtained from 10 transfected cells of the relative intensity of GFP fluorescence along the center of the axon when first detected and then 2 hr later. Note the presence of a significant (p < 0.05) increase in intensity within central segments in this 2 hr interval.
Fig. 7.
Fig. 7.
Endogenous axonal NF subunits exhibit a delayed association with NF bundles. The panels present immunoblot and autoradiographic analyses of cytoskeletons derived from perikaryal (Soma) and axonal preparations from cells that were pulse-labeled for 15 min and immediately harvested or cultures from which radiolabeled medium was replaced with medium lacking radiolabel and in which incubation was continued for a total of 4 hr, as indicated. Axonal material recovered at the interface and material that sedimented through a 1 m sucrose cushion (pellet) are indicated. The relative migration of molecular weight standards is indicated on the left side of the figure. Immunoreactive and immunoprecipitated species corresponding to NF-H, NF-M, and NF-L are indicated also. The accompanying immunoblots (probed with R39) confirm the presence of NF subunits in cytoskeletons derived from all fractions. Note that radiolabeled NF subunits are associated with perikaryal and axonal NFs within 15 min of radiolabeling, yet within axonal neurites are recovered virtually entirely from the interface and not from the pellet. Note further that by 4 hr the majority of radiolabeled subunits is associated with the pellet. Because bundled NFs sedimented through sucrose under these conditions yet individual NFs were retained at the interface, these data indicate that NF subunits associate with individual NFs within axons before their association with bundled NFs.
Fig. 8.
Fig. 8.
Nocodazole alters axonal neurite morphology and the distribution of axonal NF immunoreactivity.A, Immunofluorescent analyses of the distribution of SMI-31 and RT97 immunoreactivity with and without treatment with nocodazole for 2 hr, as indicated. Corresponding phase-contrast images are presented; note that nocodazole induces overall thinning of the axonal shaft (white arrows) with periodic varicosities or beads. The accompanying plot profiles present the distribution of NF immunoreactivity within select regions of axonal neurites; these regions are presented as insets within the graphs and are indicated by arrows in the appropriate phase-contrast image. Note that relatively more RT97 immunoreactivity is retained within shafts than is SMI-31 immunoreactivity. The accompanying bar graph presents a comparison of the relative distribution of NF immunoreactivity within varicosities versus adjacent areas of the shaft; SMI-32 immunoreactivity (not presented in micrographs) also was included in these analyses. Note that approximately fourfold more SMI-31 and SMI-32 immunoreactivity was localized within varicosities as opposed to the adjacent areas of the axonal shaft, whereas only ∼1.5-fold more RT97 immunoreactivity distributed within varicosities as opposed to the shaft. B, Biotin immunoreactivity in cells treated with nocodazole at 2 and 18 hr after injection, as indicated. Corresponding phase-contrast images are presented also. The accompanying plot profiles present the distribution of biotin immunoreactivity within select regions of axonal neurites; these regions are presented asinsets within the graphs and are indicated byarrows within the immunofluorescent images. Note that relatively more immunoreactivity is retained within shafts at 18 hr after injection. The accompanying bar graph presents the relative distribution of biotin immunoreactivity within varicosities versus adjacent areas of the shaft. Note that, when microinjected cells were treated with nocodazole at 2 hr after injection, ∼3.5-fold more biotin immunoreactivity distributed within varicosities versus adjacent areas of the shaft. Conversely, only approximately twofold more biotin immunoreactivity partitioned within beads versus shafts when nocodazole treatment was performed 18 hr after injection.

Similar articles

Cited by

References

    1. Anderton BH, Breinburg D, Downes MJ, Green PJ, Tomlinson BE, Ulrich J, Wood JN, Kahn J. Monoclonal antibodies show that neurofibrillary tangles and neurofilaments share antigenic determinants. Nature. 1982;298:84–86. - PubMed
    1. Baas PW, Brown A. Slow axonal transport: the polymer transport model. Trends Cell Biol. 1997;7:380–384. - PubMed
    1. Brady ST. Motor neurons and neurofilaments in sickness and health. Cell. 1993;73:1–3. - PubMed
    1. Brown AT. Visualization of single neurofilaments by immunofluo-rescence microscopy of splayed axonal cytoskeletons. Cell Motil Cytoskeleton. 1997;38:133–145. - PubMed
    1. Brown AT. Contiguous phosphorylated and nonphosphorylated domains along axonal neurofilaments. J Cell Sci. 1998;111:455–467. - PubMed

Publication types

MeSH terms

Substances

LinkOut - more resources