. 2001 Apr 1;21(7):2215-23.
doi: 10.1523/JNEUROSCI.21-07-02215.2001.

Propagation of intercellular calcium waves in retinal astrocytes and Müller cells

Affiliations

Propagation of intercellular calcium waves in retinal astrocytes and Müller cells

E A Newman. J Neurosci. .

Abstract

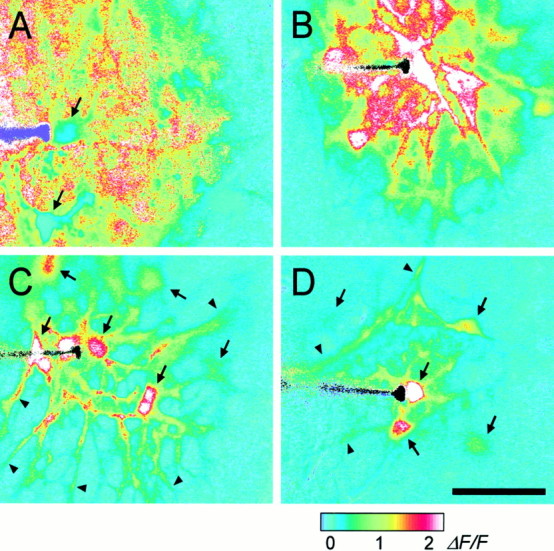
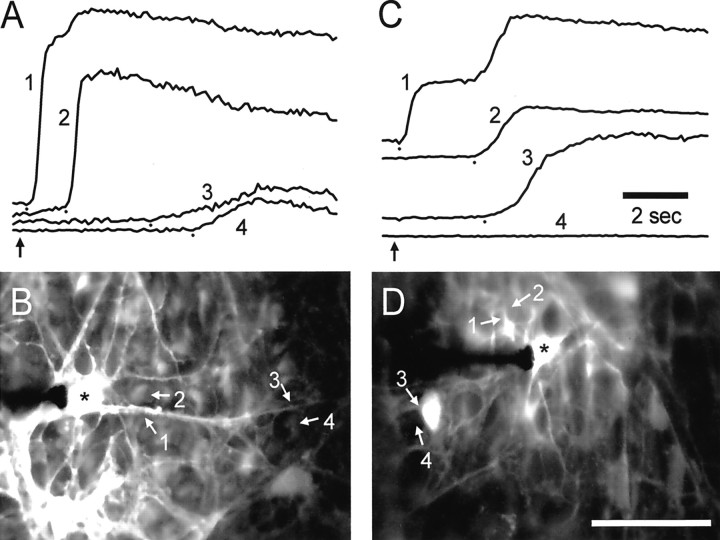
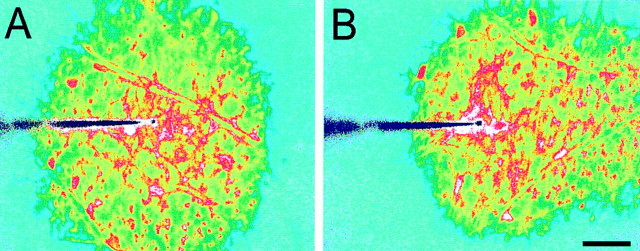
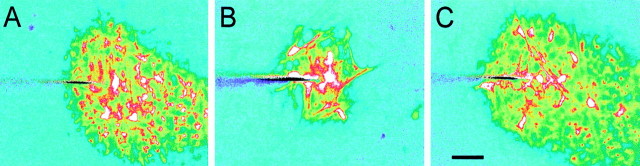
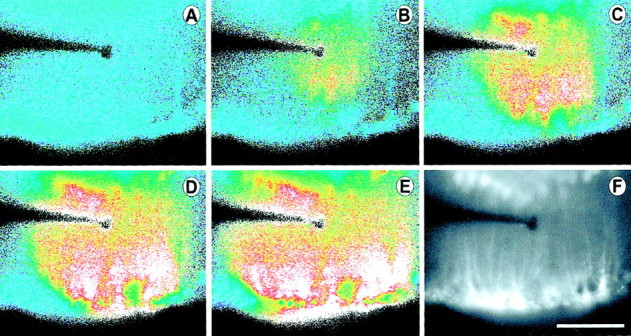
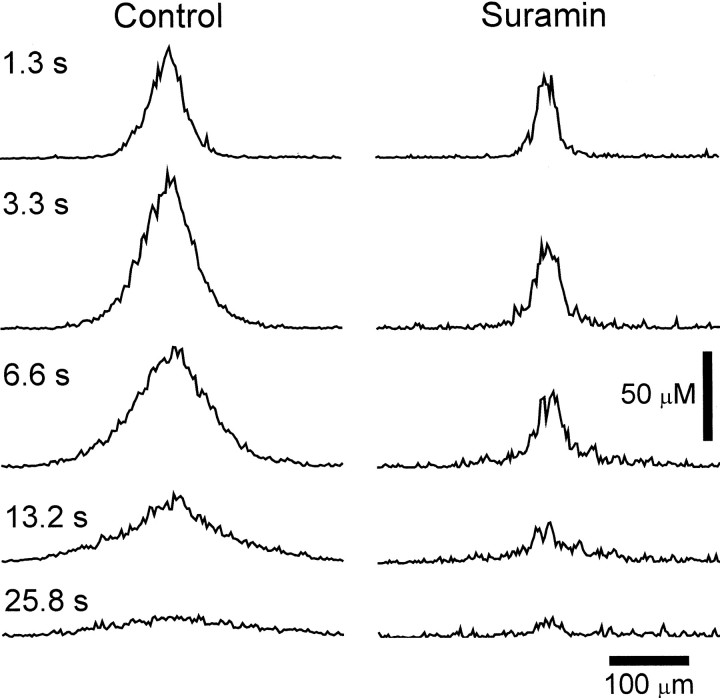
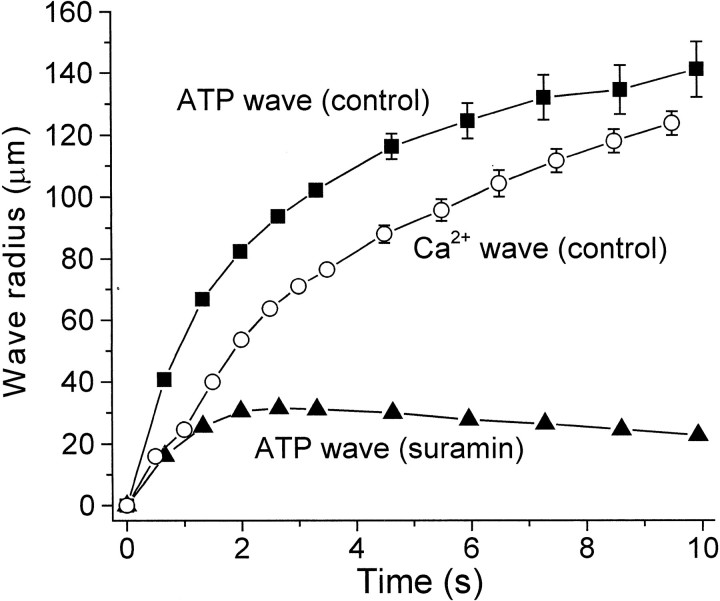
Intercellular Ca(2+) waves are believed to propagate through networks of glial cells in culture in one of two ways: by diffusion of IP(3) between cells through gap junctions or by release of ATP, which functions as an extracellular messenger. Experiments were conducted to determine the mechanism of Ca(2+) wave propagation between glial cells in an intact CNS tissue. Calcium waves were imaged in the acutely isolated rat retina with the Ca(2+) indicator dye fluo-4. Mechanical stimulation of astrocyte somata evoked Ca(2+) waves that propagated through both astrocytes and Müller cells. Octanol (0.5 mm), which blocks coupling between astrocytes and Müller cells, did not reduce propagation into Müller cells. Purinergic receptor antagonists suramin (100 microm), PPADS (20-50 microm), and apyrase (80 U/ml), in contrast, substantially reduced wave propagation into Müller cells (wave radii reduced to 16-61% of control). Suramin also reduced wave propagation from Müller cell to Müller cell (51% of control). Purinergic antagonists reduced wave propagation through astrocytes to a lesser extent (64-81% of control). Mechanical stimulation evoked the release of ATP, imaged with the luciferin-luciferase bioluminescence assay. Peak ATP concentration at the surface of the retina averaged 78 microm at the stimulation site and 6.8 microm at a distance of 100 microm. ATP release propagated outward from the stimulation site with a velocity of 41 microm/sec, somewhat faster than the 28 microm/sec velocity of Ca(2+) waves. Ejection of 3 microm ATP onto the retinal surface evoked propagated glial Ca(2+) waves. Together, these results indicate that Ca(2+) waves are propagated through retinal glial cells by two mechanisms. Waves are propagated through astrocytes principally by diffusion of an internal messenger, whereas waves are propagated from astrocytes to Müller cells and from Müller cells to other Müller cells primarily by the release of ATP.


Figures

Fig. 1.
Fig. 1.
Propagation of intercellular Ca2+ waves in retinal glial cells. A, Control. A Ca2+ wave propagates through both astrocytes and Müller cells, with large Ca2+increases occurring in both types of glial cells. [The apparent absence of Ca2+ increases in two astrocytes (arrows) is an artifact; the Ca2+signal in these cells was saturated before stimulation.]B, Octanol, 0.5 mm. A Ca2+ wave propagates through both astrocytes and Müller cells. C, Suramin, 100 μm. A Ca2+ wave propagates from the stimulated astrocyte into other astrocyte somata (arrows) and processes (arrowheads), but not into Müller cells (theblueregions between astrocytes).D, Apyrase, 80 U/ml. A Ca2+ wave propagates into several astrocyte somata (arrows) and processes (arrowheads), but not into Müller cells. Waves were evoked by mechanical stimulation of astrocyte somata. The stimulating probe is seen at the left in each panel. Recordings were from eyecups. Scale bar, 50 μm. The pseudocolor ratio images were calculated as described in Materials and Methods. The pseudocolor scale, at the bottom, indicates fluorescence ratio values for this and subsequent figures.
Fig. 2.
Fig. 2.
Propagation of Ca2+ waves from astrocytes to Müller cells. A and Cshow fluorescence intensity (arbitrary units) from selected regions of astrocytes (1, 3) and Müller cells (2, 4). The location of each region is indicated in the fluorescence images in B andD. A, B, Control. Stimulation of an astrocyte soma evokes a wave that propagates rapidly into adjacent Müller cells. Near the stimulated soma (*) the wave propagates from the astrocyte process (1) into an adjacent Müller cell (2) with a delay of 1.1 sec. Farther from the soma the delay in propagation from the astrocyte process (3) to a Müller cell (4) is 1.3 sec. C,D, PPADS, 50 μm. PPADS impairs astrocyte-to-Müller cell propagation. Near the stimulated soma (*) the wave propagates from the astrocyte process (1) to an adjacent Müller cell (2) with a delay of 2.3 sec. (The secondary rise in Ca2+ in region 1 represents the arrival of the Ca2+ wave in the Müller cells underneath the astrocyte process.) The wave propagates into the soma of a nearby astrocyte (3) but fails to invade an adjacent Müller cell (4). Recordings are from eyecups. In A and C the small dots mark the onset of Ca2+ increases, andvertical arrows indicate the time of mechanical stimulation. Scale bar in D, 50 μm.
Fig. 3.
Fig. 3.
Calcium wave propagation is altered by superfusate flow. A, Superfusate flow turned off. Propagation is symmetric. B, Superfusate flow from leftto right. Propagation is highly asymmetric. Propagation in the direction of superfusate flow is greatly extended, whereas propagation in the direction opposite the flow is reduced. The two images were obtained from nearby regions of the same retina. Waves were evoked by mechanical stimulation. The tip of the stimulating probe is near the center of the images. Shown are recordings from a whole-mount retina. Scale bar, 50 μm.
Fig. 4.
Fig. 4.
ATP receptor antagonist blocks asymmetric wave propagation. Superfusate flow is from top left to bottom right in all three trials.A, Control. Superfusate flow causes asymmetric wave propagation. B, Suramin, 100 μm. The purinergic receptor blocker eliminates the asymmetric wave propagation despite the continued superfusate flow. C, Recovery. After washout of suramin (39 min) the asymmetry in wave propagation returns. Waves were evoked by mechanical stimulation. The three images were obtained from nearby regions of the same retina. Shown are recordings from a whole-mount retina. Scale bar, 50 μm.
Fig. 5.
Fig. 5.
Propagation of an intercellular Ca2+ wave in Müller cells. Shown are images from a retinal slice, viewed looking down onto the cut surface of the slice. A–E, Pseudocolor images of Ca2+ wave propagation through Müller cells evoked by mechanical stimulation. The wave propagates in all directions within Müller cells, invading cell somata and endfeet, where large Ca2+ increases are seen. Elapsed time after stimulation in A–E: 0, 1.3, 2.0, 3.0, and 5.0 sec.F, A fluorescence image of the slice showing labeled Müller cells. Müller cell somata in the inner nuclear layer are at the top of the image. Müller cell endfeet at the vitreal surface of the retina are at the bottom. Müller cell processes (thin vertical lines) within the inner plexiform layer were stimulated by the probe. Scale bar, 50 μm.
Fig. 6.
Fig. 6.
Propagation of a wave of ATP release from the retina. ATP release was monitored via the luciferin–luciferase bioluminescence assay. ATP concentration at the retinal surface is indicated by the pseudocolor scale at thebottom. The ATP release wave was evoked by a mechanical stimulus identical to that used to elicit Ca2+waves. Elapsed time after stimulation in A–F: 0, 0.7, 2.0, 4.0, 7.9, and 16.5 sec. Shown are images from a whole-mount retina. Scale bar, 100 μm.
Fig. 7.
Fig. 7.
ATP receptor antagonist blocks propagation of ATP release wave. Spatial profiles of ATP concentration at the retinal surface are shown for five time points after stimulation.Left, Control trial. Immediately after stimulation (1.3 sec) ATP release is confined to a region near the stimulation site (center of trace). At later times ATP release occurs at greater distances from the stimulation site. Right, Suramin, 100 μm. ATP release is confined to a small region near the stimulation site, even at later times. ATP release does not propagate to neighboring regions. Shown are recordings from whole-mount retinas.
Fig. 8.
Fig. 8.
Comparison of ATP release wave and Ca2+ wave propagation. Wave radius is plotted as a function of time after stimulation for control ATP release waves (▪), ATP release waves in the presence of 100 μm suramin (▴), and control Ca2+ waves (○). Propagation of control ATP release waves precedes Ca2+ waves by ∼25 μm and ∼0.9 sec during the first seconds after stimulation. In the presence of suramin the ATP release fails to spread beyond 30 μm from the stimulation site. Threshold for detecting the leading edge of ATP waves was 3 μm ATP. Threshold for Ca2+ waves was a ΔF/F increase of 0.6. Means ± SEM are shown. n = 8, 6, and 8 for control ATP, suramin ATP, and Ca2+ waves, respectively. Shown are recordings from whole-mount retinas.

References

    1. Araque A, Parpura V, Sanzgiri RP, Haydon PG. Glutamate-dependent astrocyte modulation of synaptic transmission between cultured hippocampal neurons. Eur J Neurosci. 1998a;10:2129–2142. - PubMed
    1. Araque A, Sanzgiri RP, Parpura V, Haydon PG. Calcium elevation in astrocytes causes an NMDA receptor-dependent increase in the frequency of miniature synaptic currents in cultured hippocampal neurons. J Neurosci. 1998b;18:6822–6829. - PMC - PubMed
    1. Bezzi P, Carmignoto G, Pasti L, Vesce S, Rossi D, Lodi Rizzini B, Pozzan T, Volterra A. Prostaglandins stimulate calcium-dependent glutamate release in astrocytes. Nature. 1998;391:281–285. - PubMed
    1. Boitano S, Dirksen ER. Intercellular propagation of calcium waves mediated by inositol trisphosphate. Science. 1992;258:292–295. - PubMed
    1. Charles AC, Naus CCG, Zhu D, Kidder GM, Dirksen ER, Sanderson MJ. Intercellular calcium signaling via gap junctions in glioma cells. J Cell Biol. 1992;118:195–201. - PMC - PubMed

Publication types

LinkOut - more resources