. 2001 Apr 1;21(7):2224-39.
doi: 10.1523/JNEUROSCI.21-07-02224.2001.

The influence of glutamate receptor 2 expression on excitotoxicity in Glur2 null mutant mice

Affiliations

The influence of glutamate receptor 2 expression on excitotoxicity in Glur2 null mutant mice

K Iihara et al. J Neurosci. .

Abstract

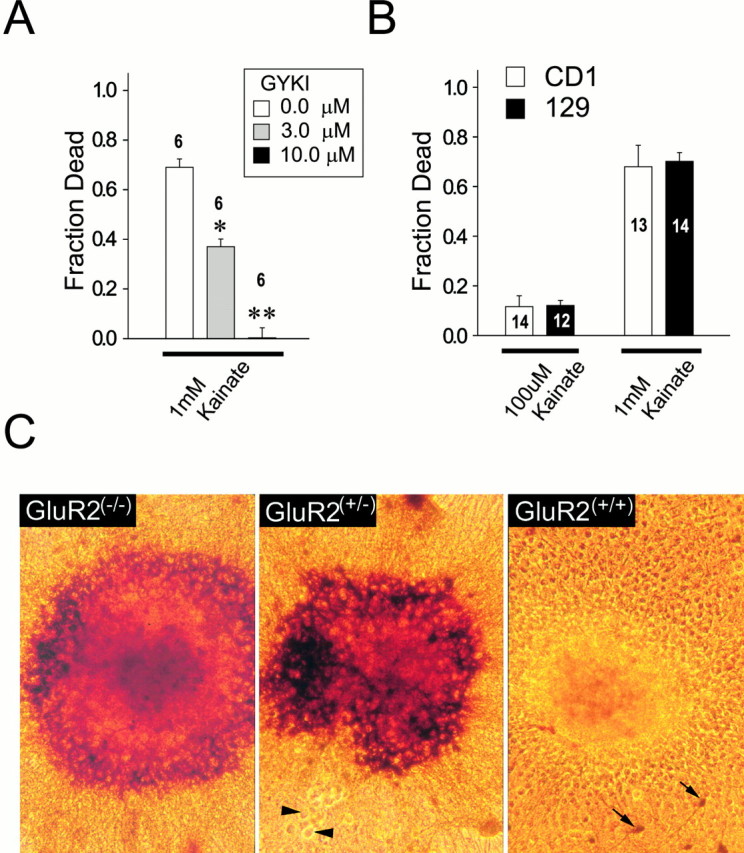
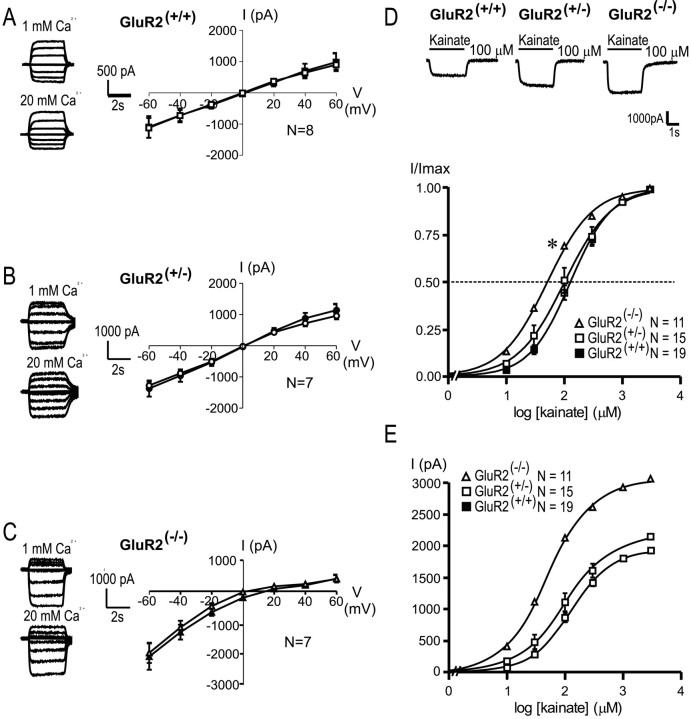
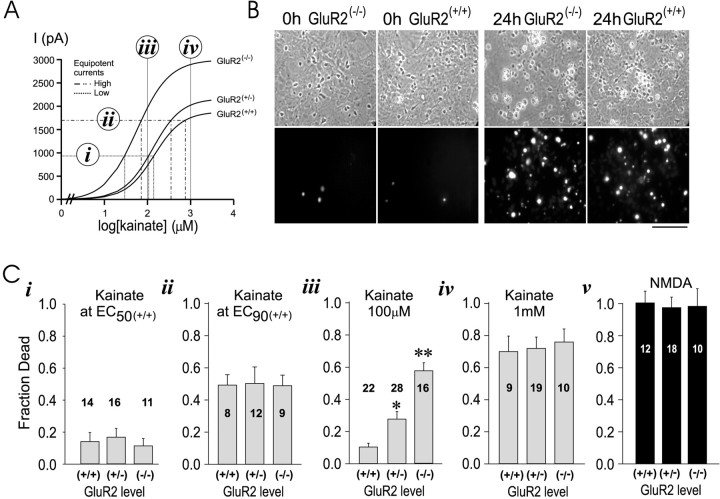
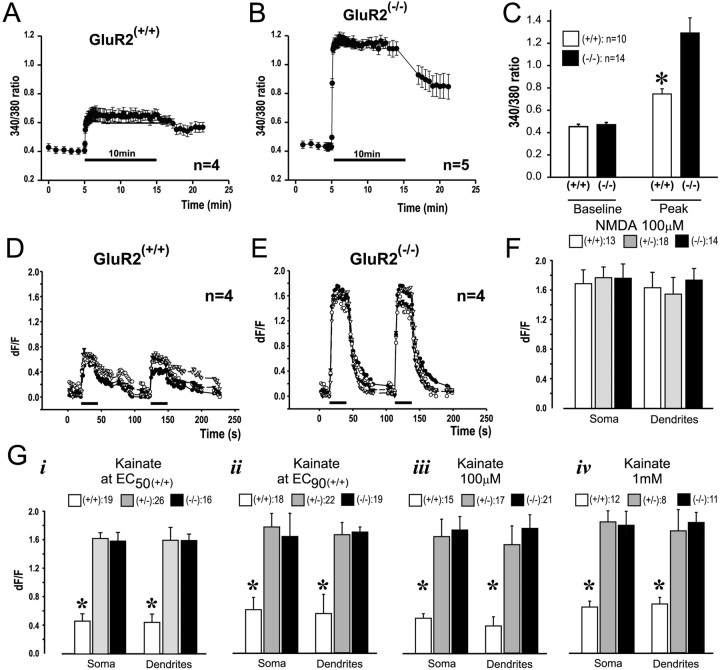
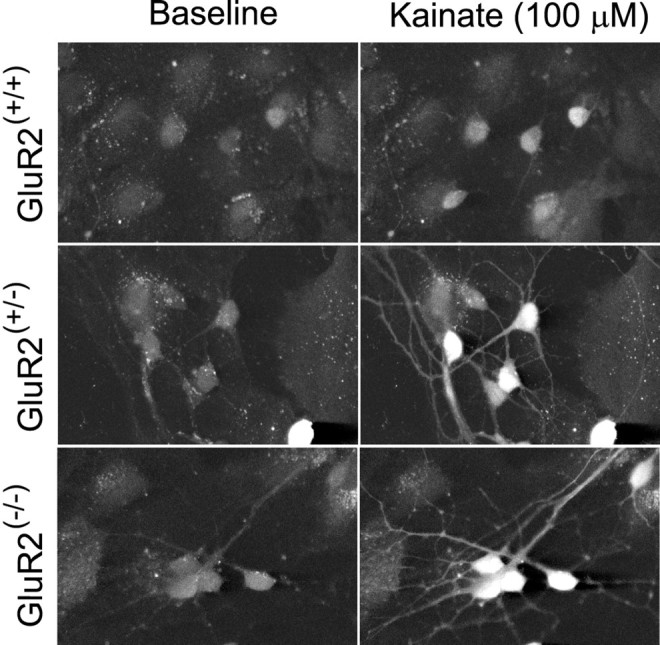
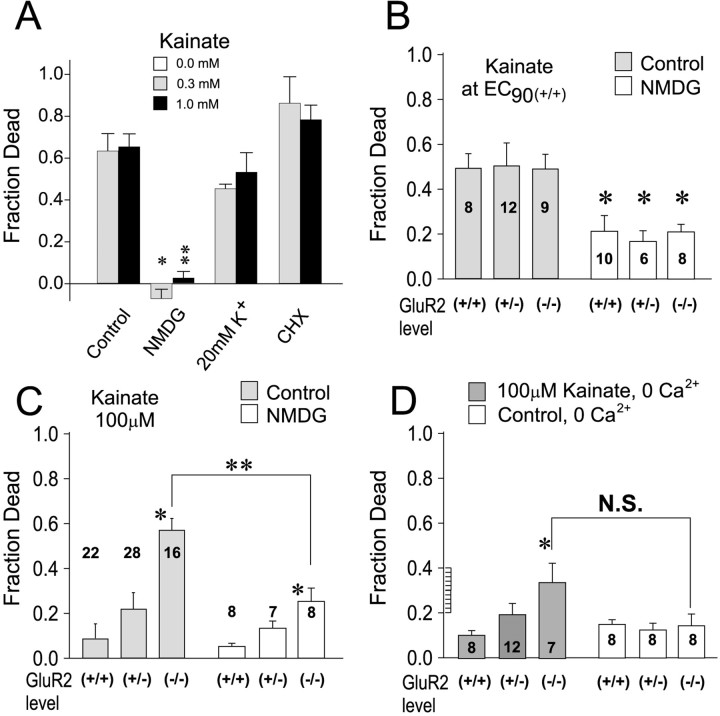
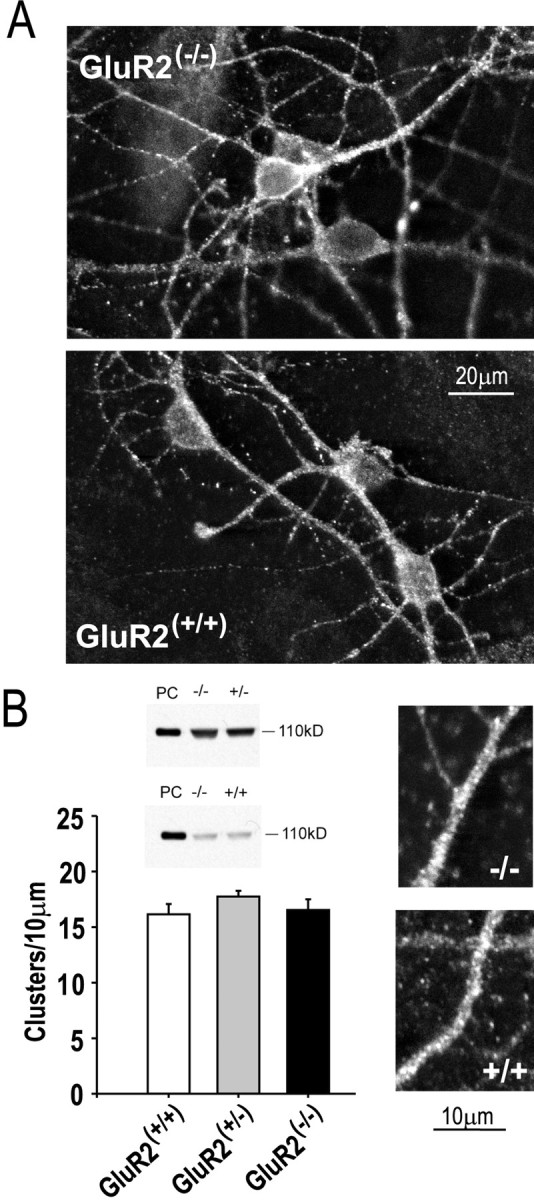
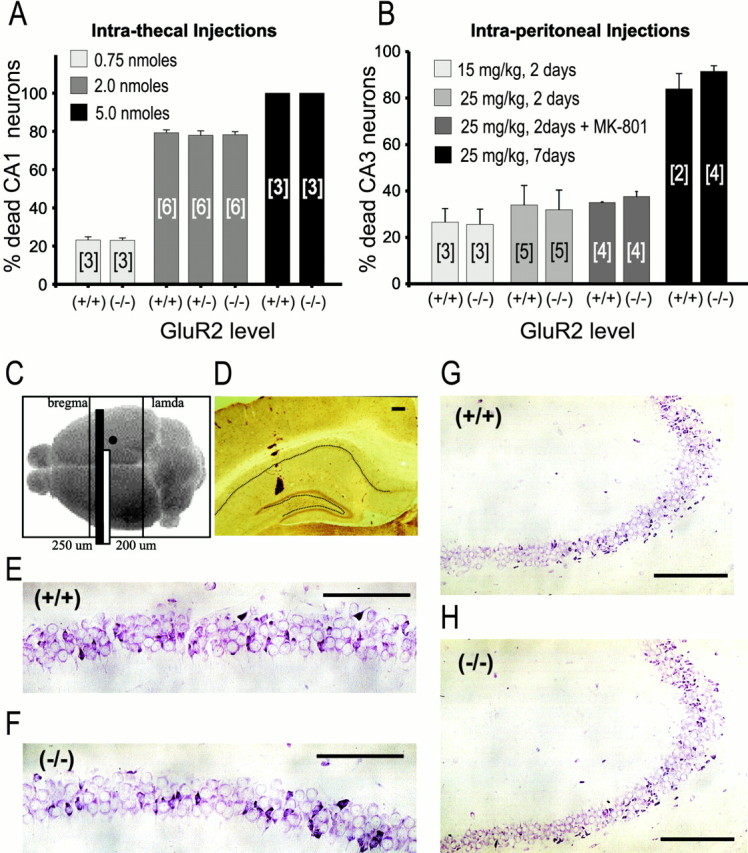
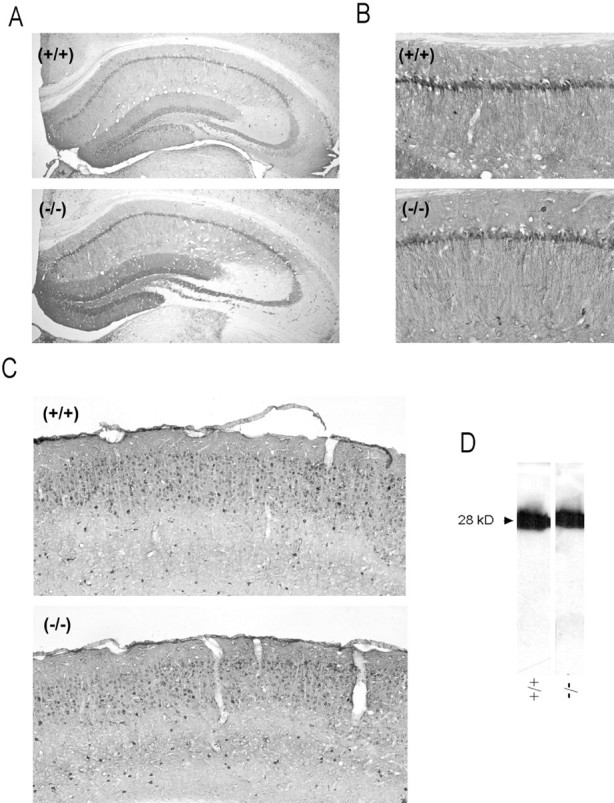
AMPA receptor (AMPAR)-mediated ionic currents that govern gene expression, synaptic strength, and plasticity also can trigger excitotoxicity. However, native AMPARs exhibit heterogeneous pharmacological, biochemical, and ionic permeability characteristics, which are governed partly by receptor subunit composition. Consequently, the mechanisms governing AMPAR-mediated excitotoxicity have been difficult to elucidate. The GluR2 subunit is of particular interest because it influences AMPAR pharmacology, Ca(2+) permeability, and AMPAR interactions with intracellular proteins. In this paper we used mutant mice lacking the AMPAR subunit GluR2 to study AMPAR-mediated excitotoxicity in cultured cortical neurons and in hippocampal neurons in vivo. We examined the hypothesis that in these mice the level of GluR2 expression governs the vulnerability of neurons to excitotoxicity and further examined the ionic mechanisms that are involved. In cortical neuronal cultures AMPAR-mediated neurotoxicity paralleled the magnitude of kainate-evoked AMPAR-mediated currents, which were increased in neurons lacking GluR2. Ca(2+) permeability, although elevated in GluR2-deficient neurons, did not correlate with excitotoxicity. However, toxicity was reduced by removal of extracellular Na(+), the main charge carrier of AMPAR-mediated currents. In vivo, the vulnerability of CA1 hippocampal neurons to stereotactic kainate injections and of CA3 neurons to intraperitoneal kainate administration was independent of GluR2 level. Neurons lacking the GluR2 subunit did not demonstrate compensatory changes in the distribution, expression, or function of AMPARs or of Ca(2+)-buffering proteins. Thus GluR2 level may influence excitotoxicity by effects additional to those on Ca(2+) permeability, such as effects on agonist potency, ionic currents, and synaptic reorganization.


Figures

Fig. 1.
Fig. 1.
Characterization of kainate toxicity in GluR2 mutant cultures. A, Kainate toxicity is mediated by AMPARs. Wild-type neurons were exposed to 1 mm kainate for 24 hr in solution containing 10 μm MK-801, 2 μm nimodipine, and (in mm): 121 NaCl, 5 KCl, 1 Na-pyruvate, 1.8 CaCl2, 25 NaHCO3, and 20 d-glucose, pH 7.4. Kainate toxicity was abolished by 10 μm (−)-GYKI 53784, a selective AMPAR antagonist (ANOVA, F = 223;p < 0.0001; n = 6 cultures per condition). *p < 0.05, **p < 0.01 differences from controls. B, No differences in vulnerability to kainate toxicity between CD1 and 129 strains at 100 μm kainate (t24 = 0.52;p = 0.61) and at 1 mm kainate (t25 = 0.26; p = 0.80). Cultures were exposed to kainate (0.1–1 mm) as above. Numbers in bars indicaten cultures per condition. C, Representative staining for kainate-activated cobalt uptake in neuronal clusters from GluR2 mutant mice. Although clusters were uncommon in the cultures, these pictures are provided to illustrate the striking differences between GluR2(+/+) and GluR2(−/−)cultures. Arrowheads, Cobalt-positive neurons in GluR2(+/+) cultures. Scale bar, 100 μm.
Fig. 2.
Fig. 2.
Enhanced Ca2+permeability and increased kainate potency in GluR2-deficient cortical pyramidal neurons. A–C, Representative kainate-evoked (100 μm) whole-cell currents and the I–Vrelationships for averaged steady-state currents in GluR2 mutant neurons recorded in low (1 mm, open symbols) and high (20 mm, filled symbols) extracellular Ca2+. Curves were fit by a fourth order polynomial equation from which interpolated reversal potentials were calculated.Erev(+/+), +1.1 ± 0.9 and +0.6 ± 1.1 mV;Erev(+/−), −0.4 ± 1.2 and −0.3 ± 1.0 mV;Erev(−/−), +4.5 ± 2.5 and +11.8 ± 2.3 mV, for low and high Ca2+, respectively. D, Representative kainate-evoked whole-cell currents and concentration–response relationships for peak kainate-evoked currents recorded in GluR2 mutant cortical pyramidal neurons. Concentration–response curves at 10, 30, 100, 300, 1000, and 3000 μm kainate were constructed and normalized to the maximal response in GluR2(+/+)(▪), GluR2(+/−) (■), and GluR2(−/−) (▵) neurons. The potencies of kainate (EC50) and Hill coefficients (nH) were determined by fitting the curves to the equation: I =Imax × 1/(1 + (EC50/[kainate])n), whereImax in the response at 3 mm kainate. GluR2(+/+)EC50, 142.252 ± 15.672 μm;nH, 1.330 ± 0.027 (n = 19). GluR2(+/−)EC50, 131.286 ± 26.692 μm;nH, 1.303 ± 0.062 (n = 11). GluR2(−/−)EC50, 56.511 ± 7.480 μm;nH, 1.159 ± 0.048 (n = 15). *Differences from GluR2(+/−) and GluR2(+/+), one-way ANOVA (F = 8.155; p = 0.001) with post hocBonferroni t tests; p < 0.05.E, Currents from D plotted without normalization to Imax.
Fig. 3.
Fig. 3.
Kainate toxicity in vitro.A, Use of the concentration–response data from Figure2E for selecting kainate concentrations for excitotoxicity experiments (i–iv). B, Appearance of GluR2(−/−)and GluR2(+/+) cultures at baseline (0 hr) and at the end (24 hr) of a challenge with 1 mm kainate, using phase contrast (top) and PI fluorescence optics (bottom). C, Effects of kainate insults on 24 hr neuronal survival, using equipotent (i, ii) and nonequipotent (iii, iv) kainate concentrations.i, EC 50 (+/+);ii, EC 90 (+/+);iii, 100 μm for all groups,iv, 1 mm for all groups; v, toxicity of NMDA (100 μm × 60 min) at 24 hr. *p < 0.05, **p < 0.01; Bonferroni t test indicating differences from GluR2(+/+). The fraction of dead neurons ini–v was obtained by averaging measurements from four cultures per mutant mouse. The digits on eachbar indicate the number of mice per group. Data for each bar were replicated from at least two litters of mutant pups.
Fig. 4.
Fig. 4.
Increased Ca2+ entry into GluR2(−/−)neurons. Kainate was applied in the presence of MK-801 and nimodipine.A–C, Experiments with fura-2. Kainate was applied for 10 min. A, Representative time course of [Ca2+]i averaged fromn = 4 GluR2(+/+) neurons.B, Representative time course of [Ca2+]i averaged fromn = 5 GluR2(−/−)neurons. C, Pooled baseline and peak [Ca2+]i measurements from three separate cultures per group. *p < 0.05 between wild-type and homozygous neurons. D, E, Confocal imaging of [Ca2+]i with fluo-3. Kainate (100 μm) was applied for 25 sec.D, Representative time course of [Ca2+]i averaged fromn = 4 GluR2(+/+) neurons.E, Representative time course of [Ca2+]i averaged fromn = 4 GluR2(−/−)neurons. F, Peak [Ca2+]i transients in the soma and dendrites of neurons measured with fluo-3 and evoked by 30 sec applications of NMDA (100 μm) in the presence of CNQX and nimodipine. Data were pooled from 13–18 cultures from two dissections.G, Peak [Ca2+]itransients measured with fluo-3 and evoked by 25 sec applications of kainate, using equipotent (i, ii) and nonequipotent (iii, iv) concentrations. i, EC 50(+/+); ii, EC 90(+/+); iii, 100 μm for all groups; iv, 1 mmfor all groups. *p < 0.01; Bonferronit test indicating differences from GluR2(+/−) and GluR2(−/−).Numbers in legends indicate numbers of cultures per group. Data were pooled from at least two dissections. Dendritic [Ca2+]i was measured 50–100 μm from the cell soma.
Fig. 5.
Fig. 5.
Representative confocal images of fluo-3 fluorescence from GluR2 mutant neurons at baseline and at the peak of a [Ca2+]i transient evoked with 100 μm kainate. Scale bar, 50 μm.
Fig. 6.
Fig. 6.
Effects of ion substitution and of GluR2 levels on kainate toxicity. A, Effect of Na+ removal, K+ supplementation, and protein synthesis inhibition on kainate toxicity in wild-type neurons. For low Na+, NMDG was substituted for NaCl in the control solution. For high-K+, 15 mm KCl was substituted for 15 mm NaCl, for a total of 20 mm K+. Cycloheximide (CHX) was applied at 1 μg/ml. *t(14) = 6.06; p < 0.0001. **t(22) = 5.83;p < 0.0001. n = 8–12 cultures per condition. B, Effect of Na+removal on the toxicity of equi-effective kainate concentrations in GluR2 mutant neurons. Data for controls are from Figure3Cii. Na+ removal had equal effects on all mutant groups (ANOVA, F = 0.16;p = 0.85) and reduced kainate toxicity by ∼50%. *Difference from same GluR2 group control.t16(+/+) = 2.83;p = 0.01.t15(+/−)= 2.30; p = 0.04.t15(−/−)= 3.59; p = 0.002. C, Effect of Na+ removal on the toxicity of 100 μmkainate in GluR2 mutants. Data for controls are from Figure3Ciii. GluR(−/−)neurons were more vulnerable to kainate toxicity than Glu(+/+) neurons both in the presence of Na+ (see Fig. 3) and in its absence (ANOVA,F = 6.4; p = 0.007 for NMDG group). *Difference from GluR(+/+), Bonferronit test; p < 0.01. Na+ removal was protective in GluR2(−/−)neurons. **Difference from controls,t22(−/−)= 3.88; p = 0.0008. D, Effect of Ca2+ removal on the toxicity of 100 μmkainate in GluR2 mutants. The control solution was modified by omitting CaCl2 and by adding 100 μm EGTA, a Ca2+ chelator. The rank order of vulnerability to kainate toxicity was proportional to the GluR2 level, with GluR(−/−)remaining more vulnerable to kainate toxicity than Glu(+/+) neurons (ANOVA, F = 3.7; p = 0.039). *Difference from GluR(+/+), Bonferroni t test;p < 0.05. N.S., No significant difference from controls (t13(−/−)= 1.55; p = 0.144).
Fig. 7.
Fig. 7.
Unchanged AMPAR expression and distribution in GluR2 mutant neurons. A, Representative punctate GluR1 immunostaining in cultured cortical neurons from GluR2 mutants.B, Quantitation of the expression and numbers of GluR1 clusters per dendrite length. Immunoblots reveal equal GluR1 levels in GluR2(−/−)and GluR2(+/−) cultures (top) and in GluR2(−/−)and GluR2(+/+) cultures (bottom) Each immunoblot is representative of three experiments. PC, Positive control, using protein from isolated rat brain membranes. Counts of GluR1 clusters were obtained from 40 randomly selected dendrite segments per group from neurons in four separate cultures. Data were averaged from counts obtained by two independent observers.Insets, Representative dendrite segments from GluR2(−/−)(top) and GluR2(+/+)(bottom) neurons imaged from cultures as inA at higher magnification.
Fig. 8.
Fig. 8.
Lack of increased kainate toxicity in GluR2(−/−)neurons in vivo. Experiments were performed in 7- to 9-week-old mice. A, Effects of intrathecal kainate injections. B, Effects of intraperitoneal injections. Neurons in A and B were counted 48 hr after injection except where marked. [n], Number of mice per group. C, Schematic of region of analysis and site of kainic acid deposition for intrathecal and intraperitoneal studies. Black circle, Site of intrahippocampal kainic acid deposition. Black bar, Hippocampal segment used in analyses. D, Position of microcapillary within the hippocampus for deposition of kainic acid. Section was stained for calretinin. Dotted line, Position of pyramidal and granule cell layers. E, F, Examples of CA1 pyramidal cell loss in animals receiving an intrahippocampal dose of 0.75 nmol of kainic acid at 48 d after injection (distance from deposition site, 325 μm); E, GluR2(+/+) animal. F, GluR2(−/−)animal. G, H, Examples of CA3 pyramidal cell loss in animals receiving an intraperitoneal kainate injection, 25 mg/kg, at 2 d. G, GluR2(+/+)animal. H, GluR2(−/−)animal. Scale bars: E, F, 100 μm;G, H, 200 μm.
Fig. 9.
Fig. 9.
Unchanged calbindin levels in the brain of GluR2 mutant mice. A, B, Representative calbindin immunostaining in the hippocampus.A, Low magnification. B, CA1 region.C, Calbindin staining in the cerebral cortex.D, Calbindin expression by Western blot analysis.

References

    1. Allison DW, Gelfand VI, Spector I, Craig AM. Role of actin in anchoring postsynaptic receptors in cultured hippocampal neurons: differential attachment of NMDA versus AMPA receptors. J Neurosci. 1998;18:2423–2436. - PMC - PubMed
    1. Ben-Ari Y. Limbic seizure and brain damage produced by kainic acid: mechanisms and relevance to human temporal lobe epilepsy. Neuroscience. 1985;14:375–403. - PubMed
    1. Bennett MV, Pellegrini-Giampietro DE, Gorter JA, Aronica E, Connor JA, Zukin RS. The GluR2 hypothesis: Ca2+-permeable AMPA receptors in delayed neurodegeneration. Cold Spring Harb Symp Quant Biol. 1996;61:373–384. - PubMed
    1. Bindonkas VP, Miller RJ. Excitotoxic degeneration is initiated at nonrandom sites in cultured rat cerebellar neurons. J Neurosci. 1995;15:6999–7011. - PMC - PubMed
    1. Blaustein MP. Calcium transport and buffering in neurons. Trends Neurosci. 1988;11:438–443. - PubMed

Publication types

MeSH terms