. 2001 Apr 1;21(7):2308-19.
doi: 10.1523/JNEUROSCI.21-07-02308.2001.

LTD induction in adult visual cortex: role of stimulus timing and inhibition

Affiliations

LTD induction in adult visual cortex: role of stimulus timing and inhibition

S P Perrett et al. J Neurosci. .

Abstract

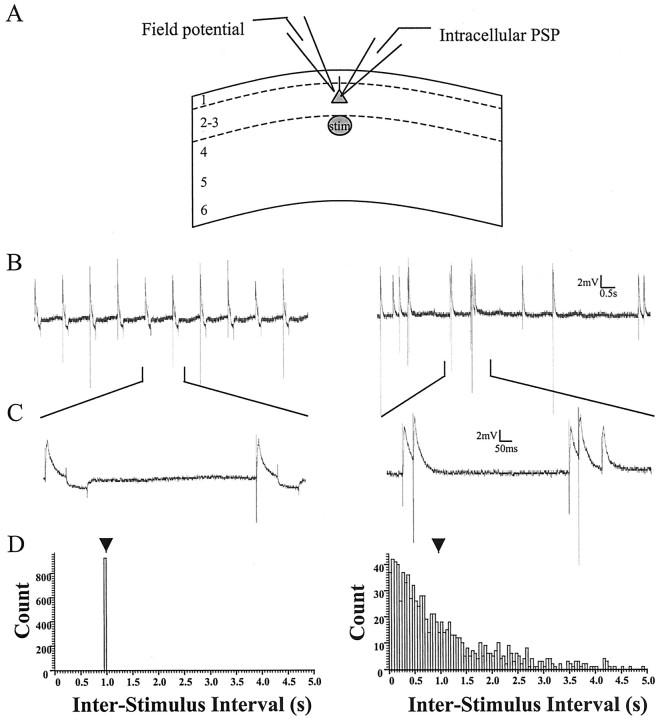
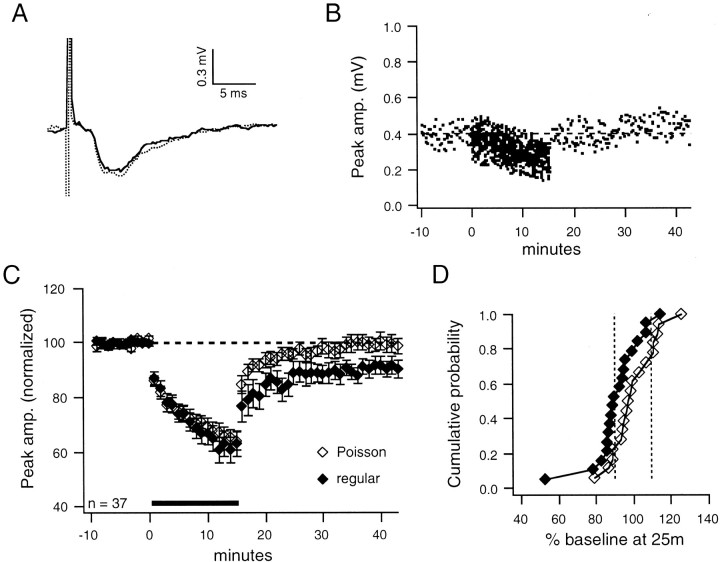
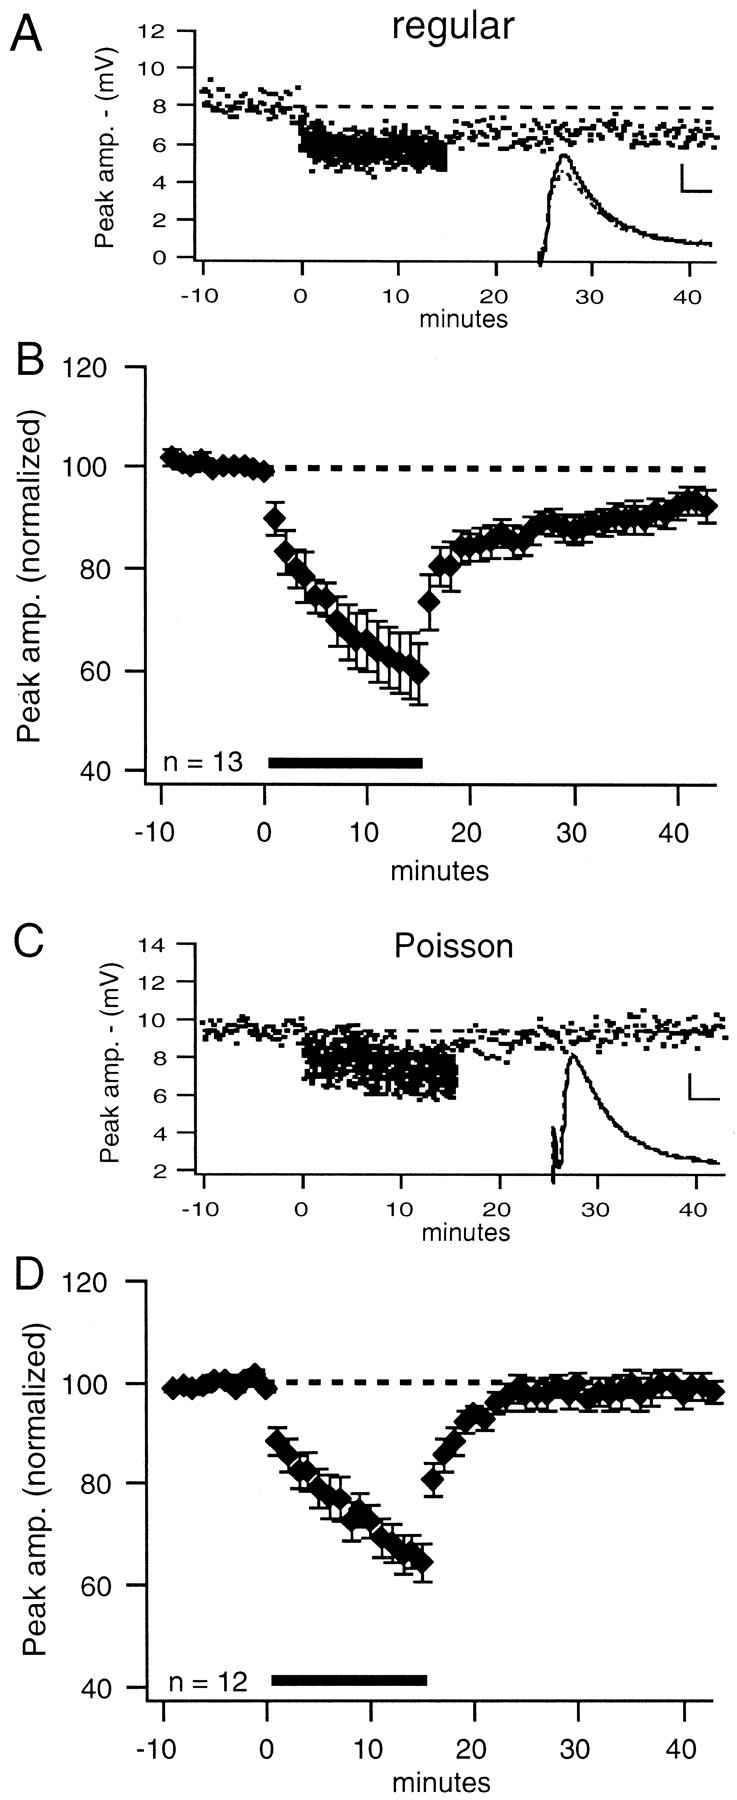
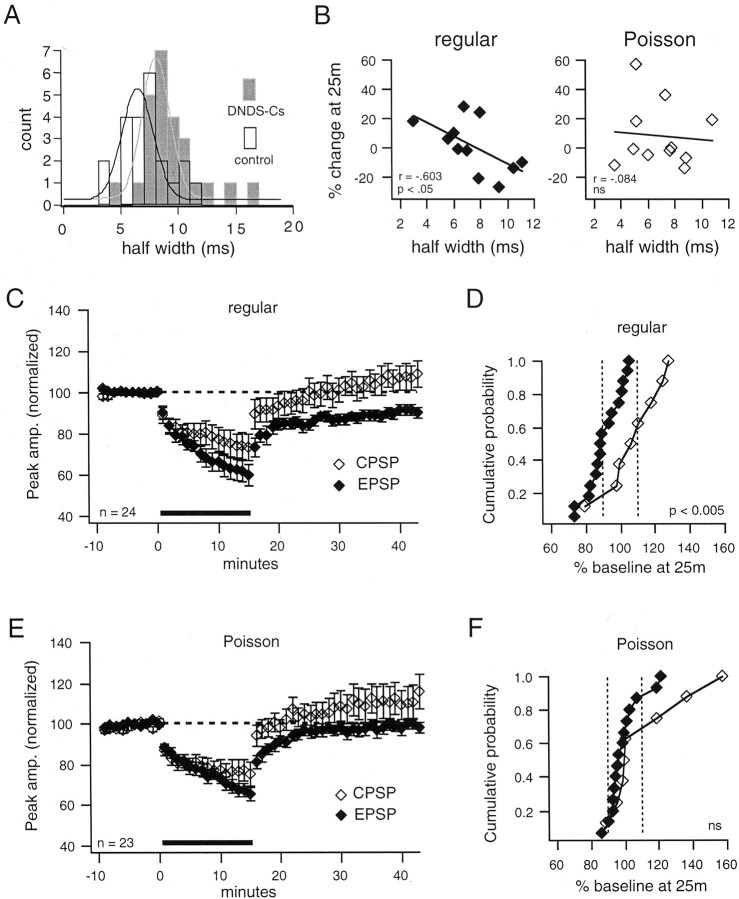
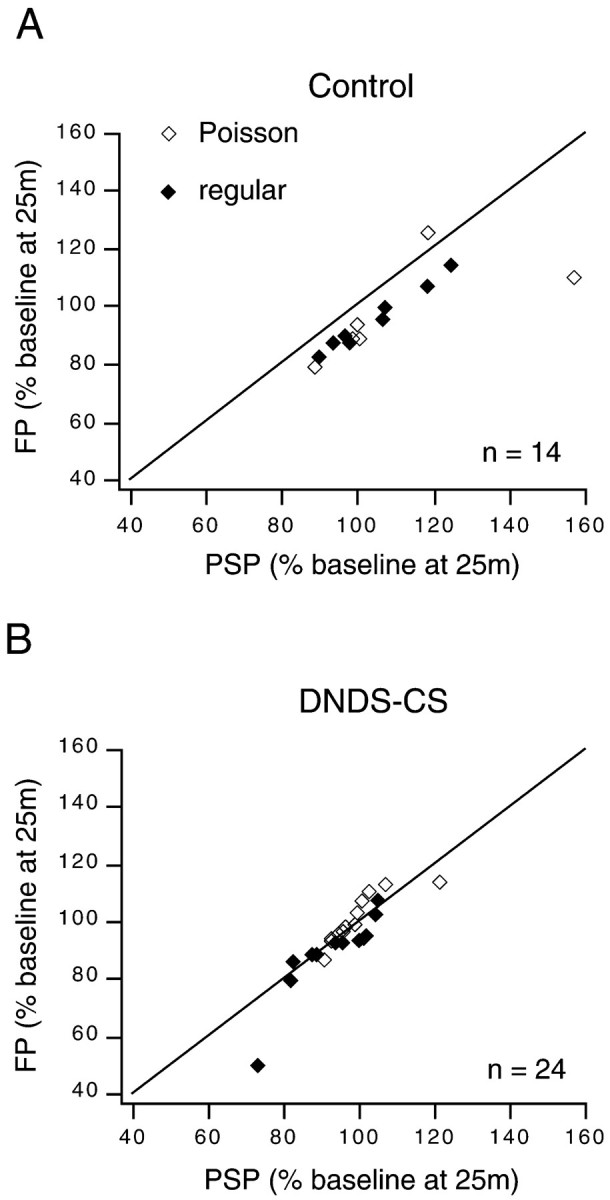
One Hertz stimulation of afferents for 15 min with constant interstimulus intervals (regular stimulation) can induce long-term depression (LTD) of synaptic strength in the neocortex. However, it is unknown whether natural patterns of low-frequency afferent spike activity induce LTD. Although neurons in the neocortex can fire at overall rates as low as 1 Hz, the intervals between spikes are irregular. This irregular spike activity (and thus, presumably, irregular activation of the synapses of that neuron onto postsynaptic targets) can be approximated by stimulation with Poisson-distributed interstimulus intervals (Poisson stimulation). Therefore, if low-frequency presynaptic spike activity in the intact neocortex is sufficient to induce a generalized LTD of synaptic transmission, then Poisson stimulation, which mimics this spike activity, should induce LTD in slices. We tested this hypothesis by comparing changes in the strength of synapses onto layer 2/3 pyramidal cells induced by regular and Poisson stimulation in slices from adult visual cortex. We find that regular stimulation induces LTD of excitatory synaptic transmission as assessed by field potentials and intracellular postsynaptic potentials (PSPs) with inhibition absent. However, Poisson stimulation does not induce a net LTD of excitatory synaptic transmission. When the PSP contained an inhibitory component, neither Poisson nor regular stimulation induced LTD. We propose that the short bursts of synaptic activity that occur during a Poisson train have potentiating effects that offset the induction of LTD that is favored with regular stimulation. Thus, natural (i.e., irregular) low-frequency activity in the adult neocortex in vivo should not consistently induce LTD.


Figures

Fig. 1.
Fig. 1.
Arrangement of electrodes and examples of patterns of stimulation used to induce changes in synaptic strength.A, Intracellular PSPs and field potentials induced by layer 4 stimulation were recorded simultaneously in layer 2/3.B, Left, One Hertz stimulation with constant intervals between stimuli is shown. Right, One Hertz stimulation with Poisson-distributed intervals between stimuli is shown. Raw data at a time scale at which stimulus artifacts can be clearly discriminated are shown. C, Segments fromB are displayed at a time scale that allows the relationship of individual PSPs to be observed. Hyperpolarizing voltage deflections after the PSP during regular stimulation are responses to 50 pA current injection that was used to monitor input resistance.D, Interstimulus interval histograms are presented for both patterns. Bin size (50 msec) and total count (900 stimuli) are the same for each case. Arrowheads indicate the mean interval of 1 sec for both patterns. Notice that the Poisson stimulation pattern contains short bursts, which allow direct voltage interactions between individual PSPs (see C), and also long periods between stimuli (see B).stim, Stimulation.
Fig. 2.
Fig. 2.
Regular stimulation at 1 Hz induces LTD of FPs.A, Average FP waveforms from a representative example illustrate LTD. FP and PSP waveforms in all figures are averages of 30 responses taken at the end of the baseline period (solid line) and at 25 min after conditioning (dashed line). B, Plot of peak amplitude over time shows stable LTD for FP illustrated in A. Dashed horizontal lines are the baseline average in all figures.C, Group average (± SEM) shows that regular stimulation at 1 Hz induces LTD (−9 ± 3%; p < 0.01) of FPs. The solid horizontal bar indicates 1 Hz conditioning stimulation in all figures. Each point is the average of six responses during the baseline period and 60 responses during the conditioning period in all figures.amp., Amplitude.
Fig. 3.
Fig. 3.
Poisson stimulation at 1 Hz does not induce LTD of FPs. A, Average FP waveforms from a representative example show no change in synaptic strength. B, Plot of peak amplitude over time shows recovery to baseline for FP illustrated in A. C, Group averages (± SEM) indicate that Poisson stimulation (open diamonds) does not induce LTD (0 ± 3%; n = 18) of FPs. The regular group (filled diamonds) is significantly different (p < 0.05) from the Poisson group at 25 min after conditioning. D, Cumulative probability plot shows the difference between Poisson and regular groups in the percentage change from baseline of the amplitude of FPs at 25 min after conditioning. Symbols in cumulative probability plots are the same as those in the corresponding peak amplitude plot in all figures. Dashed vertical lines are 90 and 110% of baseline in all figures.
Fig. 4.
Fig. 4.
Neither Poisson nor regular stimulation induces net LTD of compound intracellular PSPs; however, the sign, magnitude, and duration of changes in synaptic strength are variable across recordings. A, Representative examples show that regular (left) and Poisson (right) patterns of stimulation could induce LTD. Insets, Average PSP waveforms are shown. Calibration: 2 mV, 10 msec. B, In some recordings, a transient depression that recovered to baseline was induced. C, In some cases, a slow-developing LTP occurred. D, Group averages (± SEM) illustrate that neither regular (filled diamonds; +1 ± 6%;n = 11) nor Poisson (open diamonds; +8 ± 7%; n = 11) stimulation induced LTD in intracellular recordings. E, Cumulative probability plot of the percentage changes from baseline of the peak amplitude of the intracellular PSPs at 25 min after conditioning is shown.
Fig. 5.
Fig. 5.
The variable degree of synaptic plasticity induced by 1 Hz stimulation may result from variable recruitment of inhibition.A, The inhibitory component of compound PSPs is variable. Top, Average traces(n = 5) illustrate a PSP at its resting Vm (−85 mV; left) and at a depolarized potential (−77 mV; middle), and the two traces are superimposed (right). Holding the cell at a slightly depolarized potential with DC current injection unmasks a prominent inhibitory component.Bottom, A different PSP is shown at its resting Vm (left), at −66 mV (middle), and superimposed (right). This PSP contains a less prominent inhibitory component than does the PSP shown above despite the cell being held at a more depolarized potential. B, Diffusion of DNDS-Cs from the recording pipette blocks synaptic inhibition onto that cell. Average PSPs (n = 5) from the same cell show that, at the resting membrane potential, the PSP is increased in amplitude and broadened 30 min after impalement. C, Robust inhibition evident at depolarized potentials immediately after impalement is blocked by DNDS-Cs 30 min later. All traces inB and C are from the same cell. Times shown above or below thetraces are after impalement.
Fig. 6.
Fig. 6.
LTD of intracellular PSPs is induced by regular, but not Poisson, stimulation when inhibition onto that cell is blocked.A, In this representative example with DNDS-Cs in the pipette, regular stimulation induced LTD. B, Group data plots show that, when inhibition is blocked with DNDS-Cs, regular stimulation induces LTD (−7 ± 3%; p < 0.02; n = 13). C, In this representative example with DNDS-Cs in the pipette, Poisson stimulation did not induce LTD. D, Poisson stimulation in the presence of DNDS-Cs does not induce significant depression (−1 ± 2%; n = 12). Insets, Average PSP waveforms are shown. Calibration: 2 mV, 10 msec.
Fig. 7.
Fig. 7.
Induction of LTD depends on stimulus pattern and presence of inhibition. A, Histogram shows overlap of half-widths for control (black-outlined vertical bars) and DNDS-Cs (gray-filled vertical bars) groups.Curves (black and gray, respectively) are Gaussian fits to the data. B, Graphs show the percentage change from baseline of the PSP at 25 min plotted versus the half-width of the baseline PSP in control solution.Left, With regular stimulation, narrow PSPs are more likely to be potentiated, whereas broad PSPs are more likely to be depressed. Right, With Poisson stimulation, there is not a significant correlation between the half-width of the baseline PSP and the induction of LTP or LTD. Lines are linear fits to the data. C, The graph displays the data when PSPs with a half-width >8 msec from the control group (see Fig. 4) are pooled with those of the DNDS-Cs group to form an EPSP group and a compound PSP (CPSP) group (half-width < 8 msec). Regular stimulation induces LTD (−9 ± 3%; p< 0.005; n = 16) of the EPSP group (filled diamonds) but not of theCPSP group (open diamonds; 8 ± 6%;n = 8). The EPSP group is significantly different (p < 0.005) from the CPSPgroup. D, The cumulative probability plot reveals the difference between groups for regular stimulation. E, Poisson stimulation does not induce LTD of either the EPSP (−1 ± 3%; n = 15) or the compound PSP (+12 ± 8%;n = 8) groups. F, The cumulative probability plot shows that the EPSP and compound PSP groups are not significantly different. ns, Not significant.
Fig. 8.
Fig. 8.
Field potentials and PSPs with inhibition blocked are similar measures of synaptic plasticity induced by 1 Hz stimulation. A, With control filling solution, the percentage of the baseline at 25 min after conditioning for the FP is less than that of the simultaneously recorded PSP in 13 of 14 experiments. B, With DNDS-Cs in the pipette, the percentage of the baseline at 25 min after conditioning for a FP is equally likely to be less than (n = 12) or greater than (n = 12) that of the simultaneously recorded PSP. Changes in FPs and simultaneous PSPs are significantly correlated for both groups. Dashed lines indicate unity.

Similar articles

Cited by

References

    1. Abbott LF, Sen K, Varela JA, Nelson SB. Synaptic depression and cortical gain control. Science. 1997;275:220–222. - PubMed
    1. Abraham WC, Bear MF. Metaplasticity: the plasticity of synaptic plasticity. Trends Neurosci. 1996;19:126–130. - PubMed
    1. Abraham WC, Mason-Parker SE, Logan B. Low-frequency stimulation does not readily cause long-term depression or depotentiation in the dentate gyrus of awake rats. Brain Res. 1996;722:217–221. - PubMed
    1. Artola A, Singer W. Long-term depression of excitatory synaptic transmission and its relationship to long-term potentiation. Trends Neurosci. 1993;16:480–487. - PubMed
    1. Artola A, Bröcher S, Singer W. Different voltage-dependent thresholds for inducing long-term depression and long-term potentiation in slices of rat visual cortex. Nature. 1990;347:69–72. - PubMed

Publication types

LinkOut - more resources