. 2001 Apr 1;21(7):2330-42.
doi: 10.1523/JNEUROSCI.21-07-02330.2001.

Synapse formation is arrested in retinal photoreceptors of the zebrafish nrc mutant

Affiliations

Synapse formation is arrested in retinal photoreceptors of the zebrafish nrc mutant

B A Allwardt et al. J Neurosci. .

Abstract

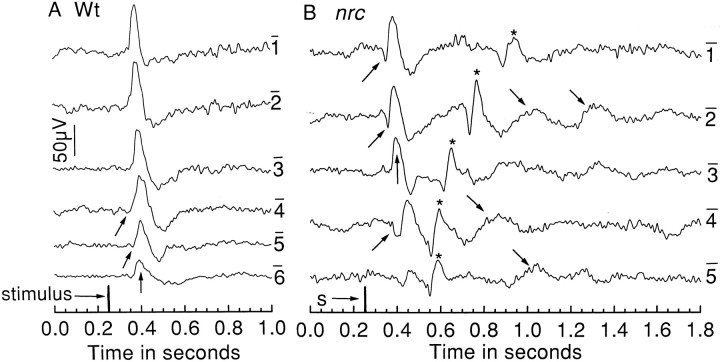
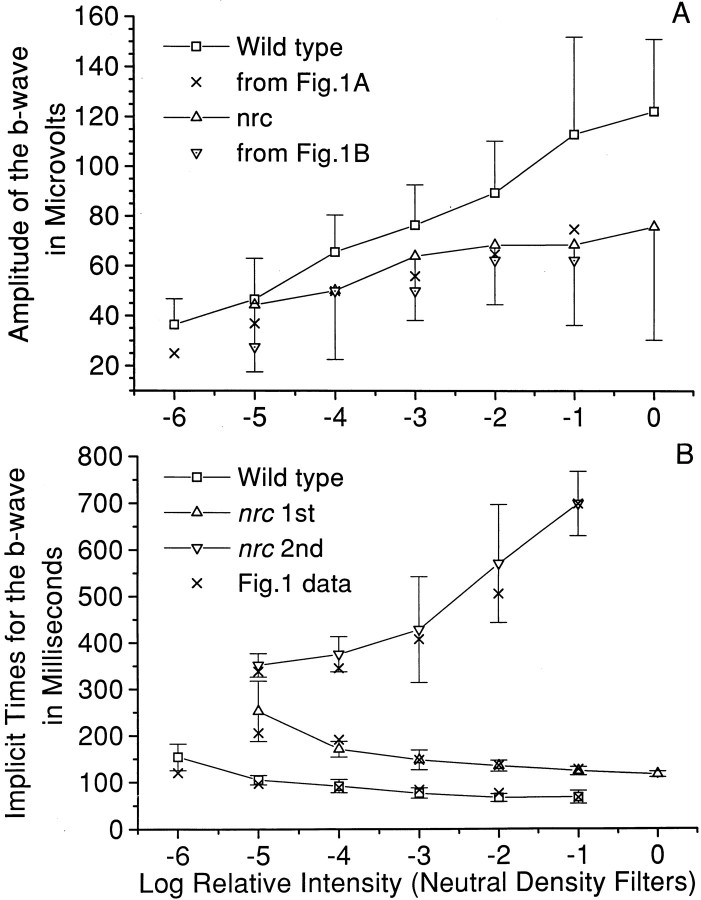
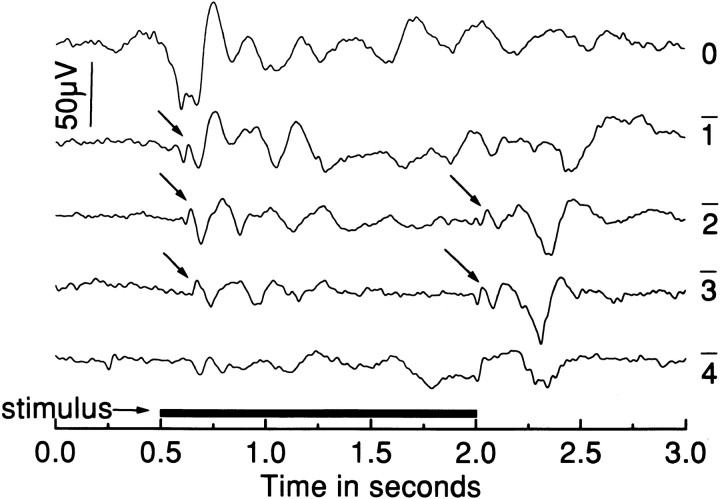
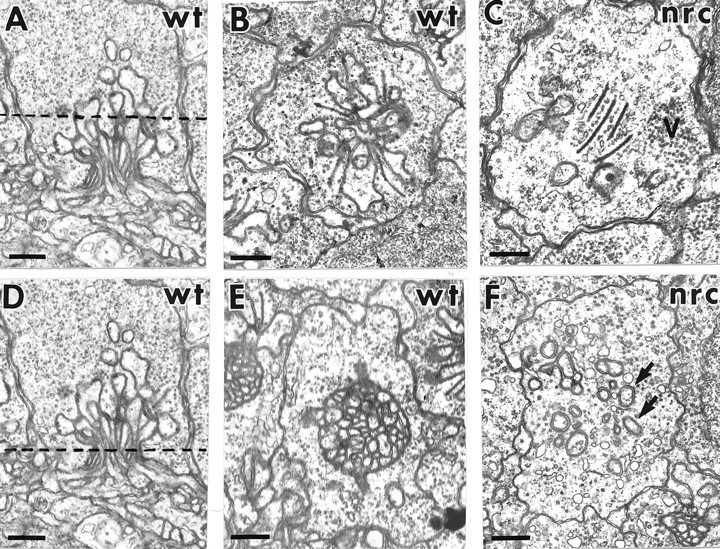
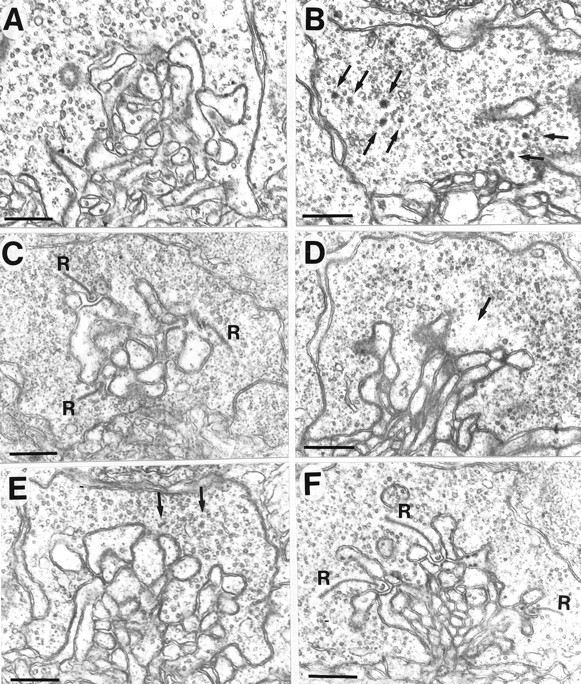
We describe the effects of a recessive mutation on visual behavior, the electroretinogram (ERG), and photoreceptor structure in zebrafish. At 6 d post-fertilization (dpf), no optokinetic reflex could be elicited in no optokinetic response c (nrc) mutant animals under any test condition. The animals exhibited ERG responses at 5-7 dpf that were markedly abnormal and could be categorized into two groups. The first showed an initial negative a-wave followed by a delayed positive b-wave of small amplitude. Often a second ERG-like response was recorded after the initial b-wave. The second group showed only a large negative a-wave; an initial b-wave was not evident. In most recordings additional oscillatory waves varying in number, amplitude, and time course were observed. Multiple responses at the cessation of long-duration flashes were also observed. Light and electron microscopy revealed that the cone photoreceptor pedicles of nrc fish were highly abnormal. Although the appropriate number of synaptic ribbons formed in these terminals, they "floated" in the terminal, unassociated with postsynaptic processes or arciform densities. The few processes invaginating the nrc pedicles resembled those of horizontal cells. Invaginating bipolar cell processes were rare, but basal contacts were observed on pedicle surfaces. The severity of the mutation did not change between 6 and 8 dpf, showing that there is neither a delay in development nor a degeneration of the terminals; rather, nrc pedicle development appears arrested. Bipolar cell terminals in the inner plexiform layer made normal ribbon synapses; thus, the mutation appears to affect only the outer retina.


Figures

Fig. 1.
Fig. 1.
ERGs recorded from a wild-type (A) and nrc mutant (B) 6 dpf zebrafish larvae. The responses were elicited by 10 msec light flashes, and the intensity of successive flashes (from bottom to top) increased by 1 log unit. On the right of each record is indicated the log attenuation of the maximum intensity (30,000 lux) flash. A varying number (n = 2–8) of individual ERGs were computer averaged for each response shown. Zebrafish ERGs typically consist of an initial small a-wave (upward slanted arrows) followed by a pronounced b-wave (vertical arrows). This is observed in both the wild-type (A) andnrc mutant (B) ERGs, but note the additional ERG-like responses (asterisks) and slow oscillatory waves (downward slanted arrows) in the mutant ERG.
Fig. 2.
Fig. 2.
A, A comparison of ERG b-wave amplitude as a function of stimulus intensity (voltage-intensity curves) for wild-type and nrc mutant fish. These data were obtained from 4–11 wild-type fish and 7–19 nrcfish. The × and ▿· data points are from Figure 1,A and B, respectively. The mutant b-wave was on average ∼1 log unit less sensitive to light, and its maximum amplitude was smaller than that of the wild-type b-wave.B, A comparison of implicit time (stimulus to peak) of the ERG b-wave as a function of stimulus intensity fornrc mutant and normal sibling larvae. These data were obtained from 2–13 wild-type and 4–21 nrc fish. The mean b-wave implicit time for the nrc mutant was almost twice as long as that for the normal siblings. Notice that the implicit time for the second ERG-like response increases tremendously as a function of intensity. The × data points are from Figure 1. The error bars in both A and B are SDs.
Fig. 3.
Fig. 3.
ERG responses recorded from threenrc mutants at 6 dpf. A, Responses elicited a few minutes apart from the same animal with the same flash intensity (log I = 0), showing the variability of response waveform that was typically recorded over time.B, Responses from two other mutants, illustrating the variety of response waveforms recorded from different animals.
Fig. 4.
Fig. 4.
ERGs elicited with 1.5 sec light flashes from annrc mutant. Responses were recorded over 4 log units of intensity; log attenuation of the maximum flash intensity is indicated to the right of each trace. The initial ON b-wave and OFF d-wave (arrows) were small in amplitude. After both the b- and d-waves, additional waves were recorded. Often, as here, the additional waves that occurred after the d-wave in the mutant animals were as large or larger than those that occurred after the b-wave.
Fig. 5.
Fig. 5.
Light micrographs of 6 dpf zebrafish retinas shown in transverse sections. A, Short single cones and a population of distal cones are seen in the wild-type retina. Pedicles are obvious, lining the distal border of the OPL (black arrows). B, Short single cones and distal cones are also present in nrc retinas, and they generally appear normal as here. However, the OPL is thinner and appears missing in some areas (open arrows). The few recognizable pedicles look abnormal (black arrow). Excessive lipid droplets are present in the PE. In this section, horizontal cell profiles are not evident; however, in most sections, normal-appearing horizontal cell bodies are seen. Scale bar, 7 μm.
Fig. 6.
Fig. 6.
The distal portions of the nrccones look quite normal, having outer segments (OS) with tightly packed membrane disks and ellipsoid mitochondria (M). A, A large number of electron-lucent lipid droplets (D) are seen in the PE of the nrc retina. B, Numerous phagosomes (P) are also seen in thenrc PE. Scale bar, 1.5 μm.
Fig. 7.
Fig. 7.
A, In the wild-type retina, bipolar and horizontal cell processes invaginate the pedicle in a tight bundle (arrow). Horizontal cells (H) are easily recognized by their large size, electron-lucent cytoplasm, and characteristic densities (small arrowheads). Synaptic ribbons (R) are associated with the presynaptic membrane via an arciform density (curved arrow).B, Basal contacts (B) are found in wild-type cones between the ribbon synapses. Inset, Under high power, the basal contacts show fluffy cytoplasmic material on both sides of the junction and filaments that span the membranes. Synaptic vesicles (V) surround the synaptic ribbons (R). C, In thenrc retina, synaptic ribbons (R) in most of the pedicles appear to be floating in the cytoplasm, unassociated with an arciform density and the presynaptic membrane. Few postsynaptic processes invaginate the pedicles; however, when present, their large size and electron-lucent appearance suggest that they are horizontal cell processes (H). Many of these processes have small densities (arrowheads), characteristic of horizontal cell processes. Basal contacts are made onto bipolar cells at the base of the pedicle (B). Synaptic vesicles (V) often clump and fail to distribute evenly in the pedicle. However, they surround synaptic ribbons as they do in wild-type pedicles (small arrows). Scale bar, 0.5 μm.
Fig. 8.
Fig. 8.
Flat (tangential) sections cut through wild-type and nrc pedicles. The dotted line shown in A approximates the depth of the sections shown inB and C. B, Numerous invaginated processes are seen in the center of the wild-type pedicle. Four ribbons encircle central processes and are flanked by large horizontal cell processes. They are associated with arciform densities. Synaptic vesicles line the ribbons and are evenly distributed in the terminal. C, An nrc pedicle sectioned at the same depth shows multiple ribbons in the center of the terminal. Few postsynaptic cell processes invaginate the pedicle, and they rarely appear to be in close apposition with the ribbons. Their large size suggests that they are horizontal cell processes. Vesicles surround the ribbons, but they also cluster in one area of the terminal (V). The dotted line shown in D approximates the depth of the flat sections shown in E and F. E, The secondary cells invaginate into the terminal in a very tight bundle in the wild-type terminal. F, In contrast, few processes invaginate into the nrc terminal, and those that do insert individually (arrows, F). Scale bar, 0.5 μm.
Fig. 9.
Fig. 9.
Cone pedicles in the developing wild-type retina.A, At 65 hpf, postsynaptic processes have invaginated into the pedicle (asterisks). B, By 67 hpf, srPBs can be seen in some terminals (arrow).C, At 69 hpf, some pedicles resemble the terminal on theleft, having invaginated postsynaptic processes and srPBs (arrows). Others resemble terminal 2 (right), having short synaptic ribbons that form triad synapses. Inset, Occasionally, srPBs are seen to be in the process of aggregating into synaptic ribbons with filaments joining them (arrowhead). Scale bar, 0.5 μm.
Fig. 10.
Fig. 10.
A, Wild-type larva (5.5 dpf) fixed 3 hr after lights were turned off at night (1 A.M.). Very few ribbons or srPBs were present in the terminals. B, Synaptic ribbons in nrc pedicles had disaggregated by 3 hr after lights were turned off (5.5 dpf; 1 A.M.). No long ribbons were seen in the pedicle; however, srPBs were present (arrows). C, E, Wild-type larva placed in constant dark on the evening of 5 dpf and fixed the following day at 11 A.M. or at 1 A.M. At 11 A.M. (C), numerous ribbons (R) were present. At 1 A.M. (E), the ribbons had disappeared and a few srPBs were observed (small arrows). D, F, Wild-type larva placed in constant light on the morning of 6 dpf and fixed at 1 A.M. or 11 A.M. the next day. D, At 1 A.M. the ribbons had disappeared; the small arrow points to a remaining srPB.F, At 11 A.M. the next day, long ribbons (R) were present associated with arciform densities. Scale bar, 0.5 μm.

Similar articles

Cited by

References

    1. Blanks JC, Adinolfi AM, Lolley RN. Synaptogenesis in the photoreceptor terminal of the mouse retina. J Comp Neurol. 1974;156:81–94. - PubMed
    1. Braekevelt CR. Retinal pigment epithelium fine structure in the velvet cichlid (Astronotus ocellatus). Anat Embryol. 1992;186:371–377. - PubMed
    1. Brockerhoff SE, Hurley JB, Janssen-Bienhold U, Neuhauss SCF, Driever W, Dowling JE. A behavioral screen for isolating zebrafish mutants with visual system defects. Proc Natl Acad Sci USA. 1995;92:10545–10549. - PMC - PubMed
    1. Brockerhoff SE, Hurley JB, Niemi GA, Dowling JE. A new form of inherited red-blindness identified in zebrafish. J Neurosci. 1997;17:4236–4242. - PMC - PubMed
    1. Bunt AH. Enzymatic digestion of synaptic ribbons in amphibian retinal photoreceptors. Brain Res. 1971;25:571–577. - PubMed

Publication types