. 2001 Apr 1;21(7):2380-92.
doi: 10.1523/JNEUROSCI.21-07-02380.2001.

Formation and function of synapses with respect to Schwann cells at the end of motor nerve terminal branches on mature amphibian (Bufo marinus) muscle

Affiliations

Formation and function of synapses with respect to Schwann cells at the end of motor nerve terminal branches on mature amphibian (Bufo marinus) muscle

G T Macleod et al. J Neurosci. .

Abstract

A study has been made of the formation and regression of synapses with respect to Schwann cells at the ends of motor nerve terminal branches in mature toad (Bufo marinus) muscle. Synapse formation and regression, as inferred from the appearance and loss of N-(3-triethylammoniumpropyl)-4-(4-(dibutylamino)styryl) pyridinium dibromide (FM1-43)-stained vesicle clusters, occurred at the ends of terminal branches over a 16 hr period. Multiple microelectrodes placed in an array about FM1-43 blobs at the ends of terminal branches detected the electrical signs of neurotransmitter being released onto receptors. Injection of a calcium indicator (Oregon Green 488 BAPTA-1) into the motor nerve with subsequent imaging of the calcium transients, in response to stimulation, often showed a reduced calcium influx in the ends of terminal branches. Injection of a fluorescent dye into motor nerves revealed the full extent of their terminal branches and growing processes. Injection of the terminal Schwann cells (TSCs) often revealed pseudopodial TSC processes up to 10-microm-long. Imaging of these TSC processes over minutes or hours showed that they were highly labile and capable of extending several micrometers in a few minutes. Injection of motor nerve terminals with a different dye to that injected into their TSCs revealed that terminal processes sometimes followed the TSC processes over a few hours. It is suggested that the ends of motor nerve terminals in vivo are in a constant state of remodeling through the formation and regression of processes, that TSC processes guide the remodeling, and that it can occur over a relatively short period of time.


Figures

Fig. 1.
Fig. 1.
Labeling components of the live motor nerve terminal. A is a longitudinal section representation of two noncontiguous portions of a motor nerve terminal (n.) with its clusters of synaptic vesicles (s.v.), lying on the skeletal muscle fiber (m.), covered by the terminal Schwann cell (t.s.c.) and clasped by the TSC fingers (t.s.c.f.). B shows the distal 30 μm of a live terminal branch that has been stained with FM1–43 to reveal the clusters of vesicles 46 min before the image was captured.C depicts a sharp microelectrode (e.) injecting a dye into the nerve terminal, which sometimes reveals a motor nerve terminal process (m.n.t.p.).D shows the same field of view as in B, 74 min after injection with AF568 and 123 min after staining with FM1–43. E depicts a sharp microelectrode injecting a dye into the nuclear region of the TSC. F shows the same field of view as in B and D, 3 min after injection of the TSC with AF488 and 123 min after staining the synaptic vesicles with FM1–43. The solid arrowheads are present to assist comparison of stained elements between imagesB, D, and F. Time stamps represent the time, in minutes (′), since staining the preparation with FM1–43. The toad was killed 5 hr 43 min before FM1–43 staining.
Fig. 2.
Fig. 2.
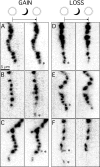
Individual clusters of synaptic vesicles, indicated by FM1–43 blobs, can appear or disappear from the ends of terminal branches over hours. FM1–43 blobs are shown along the distal portion of six terminal branches (A–F) after an initial staining with FM1–43 (left panel), and the same terminal branches are shown after restaining 16 hr later (right panel). A–C show the appearance of new clusters of FM1–43-stained vesicles on these terminal branches (asterisk), whereasD–F show the disappearance of such clusters over the same period (asterisk). The scale bar shown inA is the same for all images.
Fig. 3.
Fig. 3.
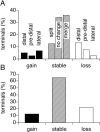
Histograms summarizing the changes in the pattern of FM1–43 blobs at terminal branches over a 16 hr period. Changes were determined over the last 10 μm of branch length for 120 terminals. The histogram in A shows the percentage of branches in which one or more new blobs appeared (filled columns) or were lost (open columns) from the most distal, predistal, or lateral portions of the distal length. Thehatched columns represent the percentage of terminals in which preexisting blobs split, preexisting blobs merged, or there was no discernible change in the pattern of blobs. The histogram inB shows the percentage of terminals in which one or more new blobs appeared (filled column), the blobs were relatively stable (hatched column; including the terminals that showed a split or merger of blobs), or one or more blobs disappeared (open column).
Fig. 4.
Fig. 4.
Signs of quantal release are detected from clusters of FM1–43-stained vesicles at the most distal end of terminal branches. A shows the distal 40 μm of a terminal branch that has been stained with FM1–43. Both boxedregions are 10 × 10 μm. An FM1–43 blob is well separated from other FM1–43 blobs at the end of a branch. B, Thetop boxed region in A is shown, together with the positions of four external recording electrodes (filled circles) arranged in a rectangular array around the most distal blob. C shows the positions of release of the spontaneous quanta (dots) and an evoked quantum (small open circle) detected over a 10 min period. D shows an amplitude–frequency histogram for 54 spontaneous quanta (open columns) and a single evoked quantum (filled column for the site inC). E–G show a similar analysis for a 10 min recording at the more proximal boxed region inA. The insets in D andG show examples of spontaneous (MEPP) and evoked (EPP) release.
Fig. 5.
Fig. 5.
Calcium influx into processes at the distal extremities of terminal branches. A shows a number of motor nerve terminal branches filled with the calcium indicator OG-1 on a group of muscle fibers. B is a closer view of the boxed region in A, which contains the most distal 20 μm of a terminal branch that possesses two varicosity enlargements. Each of thecircles contain a 1 μm2 area. The level of fluorescence in the white circles(1, 2, 3,5, 8) is the same while the nerve remains unstimulated. The level of fluorescence in the black circles (4, 6,7) is higher than that in the white circles (4 < 6 =7). C, Calcium transients at the sites indicated along the terminal branch during stimulation of the motor nerve at 30 Hz for 1 sec. The level of fluorescence is sampled once every 216 msec at each of the sites. D, Quantitative comparisons between the time courses of calcium transients from sites 1–4 in C.
Fig. 6.
Fig. 6.
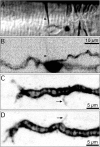
Processes at the end of TSCs. Ashows a bright-field view of the surface of a muscle fiber with a distinct TSC nucleus impaled by a microelectrode (arrowhead). B shows the same field of view as in A using epifluorescence to excite the OG-5N that is being injected into the TSC. C andD show two examples of a TSC filled with OG-5N covering the end of a terminal branch; note the TSC fingers along the length of the cell clasping the nerve terminal branch and the processes at the distal end of the branches, as well as at the side of the branches (arrows). The two branches in C andD are on the same TSC, on either side of the nucleus. The toad was killed 4 hr 10 min before the TSC in C andD was injected. The first images of TSCs were captured within minutes of filling.
Fig. 7.
Fig. 7.
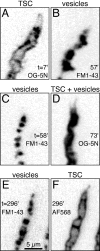
The relationship between TSCs and synaptic vesicle clusters. Three examples are shown, each consisting of a pair of images (A, B; C,D; and E, F); one image in the pair shows a TSC injected with a fluorescent dye (OG-5N or AF568), and the other image shows the nerve terminal branch stained with FM1–43. It should be noted that the TSC processes extend beyond the last FM1–43-stained vesicle cluster. In A andB, the TSC was injected with OG-5N before staining the vesicles with FM1–43; in C and D, the vesicles were stained with FM1–43 before injecting the TSC with OG-5N, and in E and F, the vesicles were stained with FM1–43 before injecting the TSC with AF568. Time stamps represent the time since filling the TSC (A, B) or the time since staining the preparation with FM1–43 (C,D and E, F). The first images of filled TSCs were captured 6 hr 2 min (A), 8 hr 31 min (D), and 5 hr 53 min (F), respectively, after toads were killed. Scale bar in E applies to all images.
Fig. 8.
Fig. 8.
Individual TSC processes grow over periods of minutes. A shows the end of an FM1–43-stained nerve terminal branch that possessed an isolated FM1–43 blob (filled arrowhead) laterally removed from the long axis of the other FM1–43 blobs. B shows, 2 min after injection of OG-5N into the TSC, the extent of the TSC processes at the end of the terminal branch. The position of the lateral FM1–43 blob from A is indicated by a filledarrowhead. C and D show the relative growth of the TSC process with respect to the fixedfilled arrowhead at 4 (C) and 7 (D) min after injection. The longest TSC process that has no associated FM1–43 blob shows no growth (open arrowhead). Another growing TSC process is shown in the image series from E to G, but it was not established whether it coincided with an isolated FM1–43 blob. Time stamps represent the time since staining the preparation with FM1–43 (A–D) or the time since filling the TSC (E–G). The first images of filled TSCs were captured 8 hr 47 min (B) and 5 hr 29 min (E), respectively, after toads were killed.
Fig. 9.
Fig. 9.
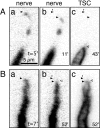
The growth of motor nerve terminal processes with respect to TSC processes. Shown are the changes in terminal processes (a, b), as well as their associated TSC processes (c, d) over a time interval of 19 min in A and 52 min in B. In each case, e and f give the superimposed images. In A, a small terminal process appears betweena and b, and this follows the left-hand TSC process that has remained stationary over this time, as shown byc and d. In B, a small terminal process appears between a and b, and this follows the central TSC process that shows little change over the time between c and d. InA, OG-5N was injected into the nerve terminal and AF568 into the TSC. In B, AF488 was injected into the nerve terminal and AF568 into the TSC. Time stamps represent the time since capturing the first images of the nerve and TSC in the before–after series. The first images of filled TSCs were captured 5 hr 16 min (Ac) and 3 hr 43 min (Bc), respectively, after toads were killed.
Fig. 10.
Fig. 10.
The regression of motor nerve terminal processes with respect to the TSC. Shown are the changes in terminal processes (a, b) over a time interval of 6 min inA and 45 min in B. In A, a long terminal process, well beyond reach of the TSC and not associated with any TSC processes, regresses between a andb. In B, the distal tip of a terminal branch regresses between a and b. The TSC revealed at the end of this period has no processes and is short of the initial extent of the distal tip of the terminal. In A, AF488 was injected into the nerve terminal and AF568 into the TSC. InB, AF568 was injected into the nerve terminal and AF488 into the TSC. Time stamps represent the time since starting to inject the motor nerve with fluorescent dye. The first images of filled TSCs were captured 4 hr 35 min (Ac) and 7 hr 46 min (Bc), respectively, after toads were killed.
Fig. 11.
Fig. 11.
Static observations of the ends of motor nerve terminal branches relative to TSCs. A–E are schematic representations of the different types of terminal branch endings (filled) relative to the TSC (dotted outline). Twenty-one terminal branches filled with AF488, AF568, OG-5N, or OG-1 were compared with their overlying TSC by injecting the TSC with a fluorescent dye of a different emission spectrum (either AF488 or AF568). The number of terminal branches described by the representations, on the initial viewing, are indicated by the number below each. The scale of the features is consistent within the diagram with the terminal branch proper being ∼2 μm in diameter.
Fig. 12.
Fig. 12.
Grayscale representations of the probability of release. A shows the solution for an event in which the position of release may be assigned unambiguously; in B, two peaks exist with (approximately) equal probability.

Similar articles

Cited by

References

    1. Ahmari SE, Buchanan J, Smith SJ. Assembly of presynaptic active zones from cytoplasmic transport packets. Nat Neurosci. 2000;3:445–451. - PubMed
    1. Anzil AP, Bieser A, Wernig A. Light and electron microscopic identification of nerve terminal sprouting and retraction in normal adult frog muscle. J Physiol (Lond) 1984;350:393–399. - PMC - PubMed
    1. Astrow SH, Qiang H, Ko CP. Perisynaptic Schwann cells at neuromuscular junctions revealed by a novel monoclonal antibody. J Neurocytol. 1998;27:667–681. - PubMed
    1. Balice-Gordon RJ, Lichtman JW. In vivo visualization of the growth of pre- and postsynaptic elements of neuromuscular junctions in the mouse. J Neurosci. 1990;10:834–855. - PMC - PubMed
    1. Bennett MR, Pettigrew AG. The formation of synapses in amphibian striated muscle during development. J Physiol (Lond) 1975;252:203–239. - PMC - PubMed

LinkOut - more resources