. 2001 Apr;75(8):3509-19.
doi: 10.1128/JVI.75.8.3509-3519.2001.

Sequence requirements for Sindbis virus subgenomic mRNA promoter function in cultured cells

Affiliations

Sequence requirements for Sindbis virus subgenomic mRNA promoter function in cultured cells

M M Wielgosz et al. J Virol. 2001 Apr.

Abstract

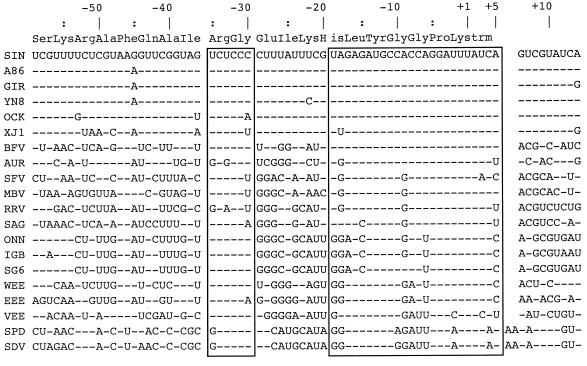
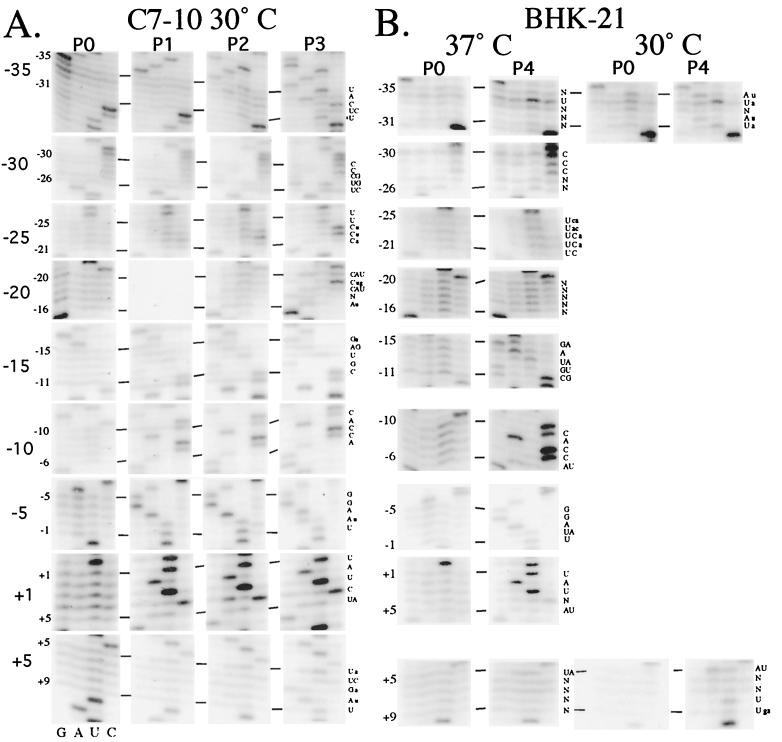
The Sindbis virus minimal subgenomic mRNA promoter (spanning positions -19 to +5 relative to the subgenomic mRNA start site) is approximately three- to sixfold less active than the fully active -98 to +14 promoter region. We identified two elements flanking the -19 to +5 region which increase its transcription to levels comparable to the -98 to +14 region. These elements span positions -40 to -20 and +6 to +14 and act synergistically to enhance transcription. Nine different virus libraries were constructed containing blocks of five randomized nucleotides at various positions in the -40 to +14 region. On passaging these libraries in mosquito cells, a small subset of the viruses came to dominate the population. Sequence analysis at the population level and for individual clones revealed that in general, wild-type bases were preferred for positions -15 to +5 of the minimal promoter. Base mutagenesis experiments indicated that the selection of wild-type bases in this region was primarily due to requirements for subgenomic mRNA transcription. Outside of the minimal promoter, the -35 to -29 region contained four positions which also preferred wildtype bases. However, the remaining positions generally preferred non-wild-type bases. On passaging of the virus libraries on hamster cells, the -15 to +5 region again preferred the wild-type base but most of the remaining positions exhibited almost no base preference. The promoter thus consists of an essential central region from -15 to +5 and discrete flanking sites that render it fully active, depending on the host environment.


Figures

FIG. 1
FIG. 1
Subgenomic mRNA promoter region of alphaviruses. The numbering denotes positions relative to the subgenomic mRNA initiation site. Identity to the SIN sequence is denoted by dashes. The boxes enclose the two conserved regions. The nsP4 sequence of SIN is shown above the sequence alignment. Abbreviations: A86, GIR, YN8, OCK, XJ1, Sindbis-like S.A.AR86, Girdwood, YN87448, Ocklebo and XJ-160 viruses, respectively; BFV, Barma Forest virus; AUR, Aura virus; SFV, Semliki Forest virus; MBV, Middelburg virus; RRV, Ross River virus; SAG, Sagiyama virus; ONN, O'nyong nyong virus; IGB and SG6, O'nyong nyong virus-like Igbo Ora and SG650 viruses; WEE, western equine encephalitis virus; EEE, eastern equine encephalitis virus; VEE, Venezuelan equine encephalitis virus; SPD, salmon pancreas disease virus; SDV, rainbow trout sleeping disease virus (4, 13, 16, 17, 21, 24, 26, 35, 38, 40, 43, 45).
FIG. 2
FIG. 2
Regions flanking the minimal SIN promoter which enhance transcription and virus fitness. (A) The TCS, −98/+5, −40/+14, −40/+5, −19/+14, and −19/+5 viruses were used to infect C7-10 cells at a MOI of 3. Viral RNA was labeled in vivo with [32P]orthophosphate between 21.5 and 24 h p.i. Total RNA was resolved on a 1% agarose gel for analysis via autoradiography. The relative STR promoter activities shown below each lane were calculated by dividing the abundance of CAT subgenomic mRNA by that of STR subgenomic mRNA for each virus, and normalizing these values to that obtained for TCS. ∗, RNA II terminating at the STR promoter; #, RNA II terminating at the CAT promoter. (B) Effect of the −40/−20 and +6/+14 regions on viral fitness. Mixtures of the in vitro transcripts listed in each panel (I = −98/+5, −40/+5, and −19/+5 mixture; II = −98/+14 [TCS], −40/+14, and −19/+14 mixture; III = −19/+14 and −19/+5 mixture; IV = −40/+14 and −40/+5 mixture) were transfected into C7-10 cells and passaged two or three times using a MOI of ≤0.1 (P0 = transfected cells). Total-cell RNA was isolated at each passage, and the viral STR promoter regions were 32P radiolabeled during RT-PCR. The PCR products were resolved on an 8% sequencing gel for analysis by autoradiography. The relative abundance of each virus in the mixes is listed below each lane, ranked by the size of their PCR products, in bases: TCS (233 bases), −98/+5 (224 bases), −40/+14 (175 bases), −40/+5 (166 bases), −19/+14 (154 bases), and −19/+5 (147 bases).
FIG. 3
FIG. 3
Evolution of the −35/+9 promoter region during passaging in cultured cells. In vitro-transcribed RNA from each library was transfected into C7-10 cells (A) or BHK-21 cells (B). The virus produced by the transfected cells were then passaged three or four times at a MOI ≤ 0.1 (see Materials and Methods). Intracellular viral RNA during each passage was isolated, and the STR promoter region was RT-PCR amplified. The RT-PCR product was purified and sequenced directly to obtain the consensus sequence of each population after each passage (P0 = transfected cells). The sequences shown are those of the minus strand.
FIG. 4
FIG. 4
SIN promoter. (A) Consensus sequence of the virus populations after three passages on C7-10 cells at 30°C (Fig. 3A). Consensus bases are those that show obvious enrichment over the other bases (Fig. 3A). Bases that were found to be wild type are underlined. Positions that appeared to prefer more than one base are designated by the standard single-letter code (R = G or A; Y = U or C; S = G or C; W = A or U; K = G or U; H = A, U, or C; D = A, G, or U; N = A, C, G, or U). (B) Consensus sequence of individual clones sampled from the C7-10 P3 virus population (Table 3). Unambiguous bases are those found at a frequency of ≥0.6, except for positions −25 and −16, where the dominant base had a frequency of 0.5 but the other bases each had frequency of ≤0.2. (C). Consensus sequence of the virus populations after four passages on BHK-21 cells at 37°C (Fig. 3B). (D) Consensus sequence of the −35 and +5 virus populations after four passages on BHK-21 cells at 30°C (Fig. 3B). Blanks indicate that populations were not tested.
FIG. 5
FIG. 5
Promoters of P3 clones. (A) Promoter activity. C7-10 or BHK-21 cells were infected with the most frequently isolated virus from each P3 population (Table 3) and an isolate from the −20 library at P0 with promoter sequence of 3′AAGCU. Viral RNAs were radiolabeled in vivo with [32P]orthophosphate at 3 h (BHK-21) or 21.5 h (C7-10) p.i. and isolated at 5 or 24 h p.i., respectively. Total RNA was denatured and resolved on a 1% agarose gel. [32P]orthophosphate-radiolabeled RNA was examined via autoradiography and phosphorimager analyses. G denotes the genomic RNA of each clone; CAT denotes CAT mRNA transcribed by the −98/+14 CAT subgenomic mRNA promoter; and STR denotes STR mRNA transcribed by the STR promoter region of each virus. Relative promoter activity, listed below each lane, was determined by finding the ratio of STR to CAT mRNA for each sample and normalizing the values against that calculated for TCS. (B) Fitness of the viruses. The viruses were competed against TCS by transfecting approximately equal amounts of the respective in vitro transcripts into C7-10 cells. The resulting virus populations were passaged three more times. The promoter region of viruses in each mix is amplified by RT-PCR, labeled, and gel resolved as described in the legend to Fig. 2B. The relative abundance of each P3 virus relative to that of TCS is listed below each lane. The size of the PCR product from TCS is 233 bp, that from the P3 clones is 175 bp, and that from the −19/+5 virus is 147 bp.
FIG. 6
FIG. 6
Effect of point mutations in the −19/+5 region on promoter activity. DI constructs with double promoters were used to measure the activity of each mutant promoter relative to the wild-type internal control (see Materials and Methods). The values obtained were then normalized against that obtained for the DIC20a construct, both of whose promoters were the wild-type −19/+5 promoter, and expressed as a percentage of wild-type activity. The top line shows the wild-type SIN sequence. Each value in subsequent lines corresponds to the promoter activity due to the base change at the indicated nucleotide position. For example, an A-to-G mutation at position −18 has 90% of wild-type activity.

Similar articles

Cited by

References

    1. Barr J N, Whelan S P, Wertz G W. cis-Acting signals involved in termination of vesicular stomatitis virus mRNA synthesis include the conserved AUAC and the U7 signal for polyadenylation. J Virol. 1997;71:8718–8725. - PMC - PubMed
    1. Barr J N, Whelan S P, Wertz G W. Role of the intergenic dinucleotide in vesicular stomatitis virus RNA transcription. J Virol. 1997;71:1794–1801. - PMC - PubMed
    1. Carmichael G G, McMaster G K. The analysis of nucleic acids in gels using glyoxal and acridine orange. Methods Enzymol. 1980;65:380–391. - PubMed
    1. Chang G J, Trent D W. Nucleotide sequence of the genome region encoding the 26S mRNA of eastern equine encephalomyelitis virus and the deduced amino acid sequence of the viral structural proteins. J Gen Virol. 1987;68:2129–2142. - PubMed
    1. Chen M H, Roossinck M J, Kao C C. Efficient and specific initiation of subgenomic RNA synthesis by cucumber mosaic virus replicase in vitro requires an upstream RNA stem-loop. J Virol. 2000;74:11201–11209. - PMC - PubMed

Publication types

MeSH terms

LinkOut - more resources