. 2001 Apr 1;29(7):1608-15.
doi: 10.1093/nar/29.7.1608.

Identification of thermophilic species by the amino acid compositions deduced from their genomes

Affiliations

Identification of thermophilic species by the amino acid compositions deduced from their genomes

D P Kreil et al. Nucleic Acids Res. .

Abstract

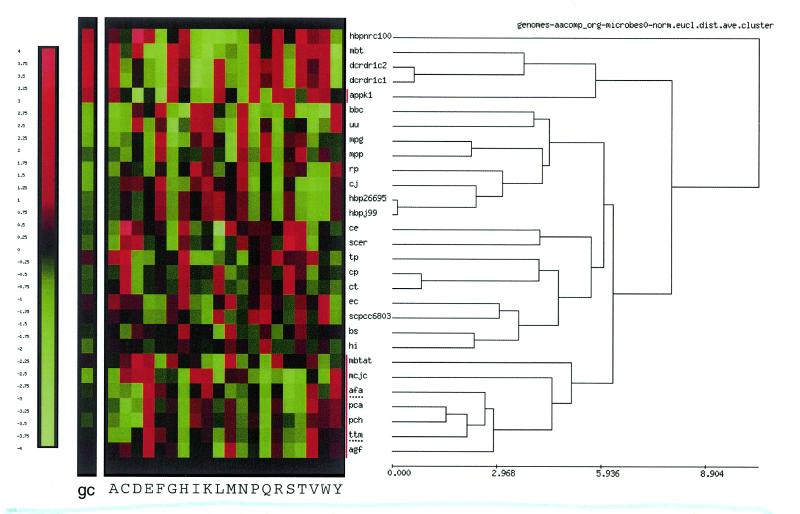
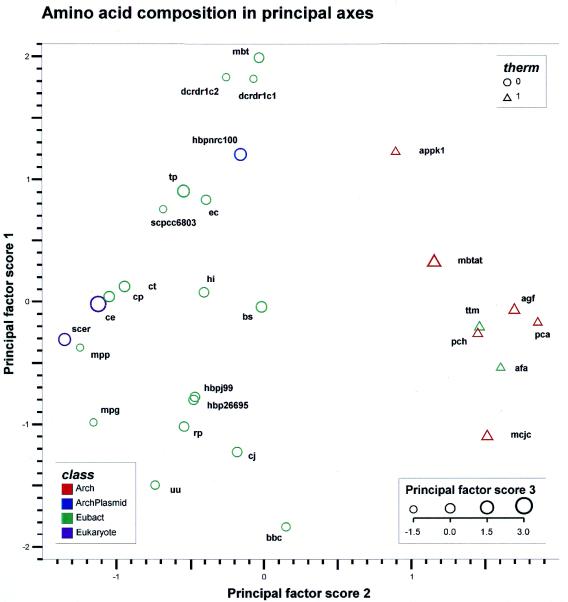
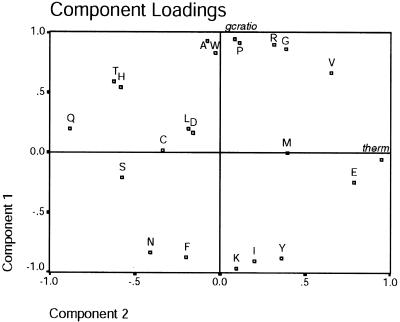
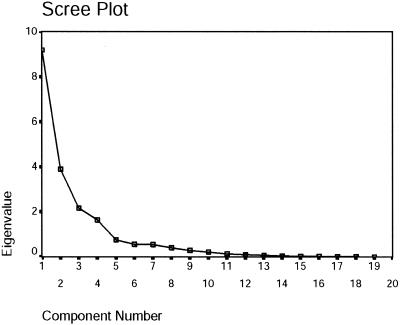
The global amino acid compositions as deduced from the complete genomic sequences of six thermophilic archaea, two thermophilic bacteria, 17 mesophilic bacteria and two eukaryotic species were analysed by hierarchical clustering and principal components analysis. Both methods showed an influence of several factors on amino acid composition. Although GC content has a dominant effect, thermophilic species can be identified by their global amino acid compositions alone. This study presents a careful statistical analysis of factors that affect amino acid composition and also yielded specific features of the average amino acid composition of thermophilic species. Moreover, we introduce the first example of a 'compositional tree' of species that takes into account not only homologous proteins, but also proteins unique to particular species. We expect this simple yet novel approach to be a useful additional tool for the study of phylogeny at the genome level.


Figures

Figure 1
Figure 1
Standardised amino acid composition data of completely sequenced organisms grouped by hierarchical clustering. The GC ratios are shown for reference but were not used for the clustering process. Amino acids are abbreviated by the standard one letter code. The labels indicating the data sets for each row are explained in Table 1. In this figure, labels for thermophiles are marked with a red vertical bar, the thermophilic bacteria are highlighted by a dotted underline. The coloured blocks show normalised values as seen from the colour bar at the left. Red and green mean more and less than average, respectively. The scale for the dendrogram represents Eucledian distance. See Materials and Methods for details.
Figure 2
Figure 2
Reduced dimensionality plot showing the main principal components of the global amino acid compositions. The first principal axis (vertical) corresponds to GC ratio (see text). The second principal axis (horizontal) shows a clear separation of thermophiles and mesophiles, denoted by triangles and circles, respectively. The third principal component is depicted by symbol size (see insert for scale). Colour groups the sources into archea (red), bacteria (green) and eukaryotes (purple). The plasmid (the outgroup for hierarchical clustering, Fig. 1) is shown in blue. The graph is a projection, and distances are therefore not directly comparable to the distances observed in Figure 1. See text for discussion. For an explanation of data set labels see Table 1.
Figure 3
Figure 3
Component loadings for the main principal components. Component loadings can be interpreted as correlation coefficients (10). This plot shows to what degree the original variables contribute to the principal components. The figure further displays the correlations to the observed GC ratio and therm, the binary variable indicating thermophily (see Materials and Methods). These are shown for reference but have not been used as PCA input. Component loadings with an absolute value of ≥0.6 are commonly considered as high.
Figure 4
Figure 4
Scree plot of extracted eigenvalues. The eigenvalue, or characteristic root, for a given factor reflects the variance in all the original variables that is accounted for by that factor (10). The first two factors already account for >65% of the variation in the original 20 variables (see Appendix).

References

    1. Haney P.J., Badger,J.H., Buldak,G.L., Reich,C.I., Woese,C.R. and Olsen,G.J. (1999) Thermal adaptation analyzed by comparison of protein sequences from mesophilic and extremely thermophilic Methanococcus species. Proc. Natl Acad. Sci. USA, 96, 3578–3583. - PMC - PubMed
    1. McDonald J.H., Grasso,A.M. and Rejto,L.K. (1999) Patterns of temperature adaption in proteins from Methanococcus and Bacillus. Mol. Biol. Evol., 16, 1785–1790. - PubMed
    1. Jaenicke R. and Böhm,G. (1998) The stability of proteins in extreme environments. Curr. Opin. Struct. Biol., 8, 738–748. - PubMed
    1. Perutz M.F. (1978) Electrostatic effects in proteins. Science, 201, 1187–1191. - PubMed
    1. Kreil D.P. and Etzold,T.M. (2000) SRS—access to molecular biological databanks and integrated data analysis tools. In Higgins,D. and Taylor,W. (eds), Bioinformatics—A Practical Approach. Oxford University Press, Oxford, UK, pp. 215–241.

Publication types