

Two-phase unfolding pathway of ribonuclease A during denaturation induced by dithiothreitol
- PMID: 11266618
- PMCID: PMC2373942
- DOI: 10.1110/ps.20801
Two-phase unfolding pathway of ribonuclease A during denaturation induced by dithiothreitol
Abstract
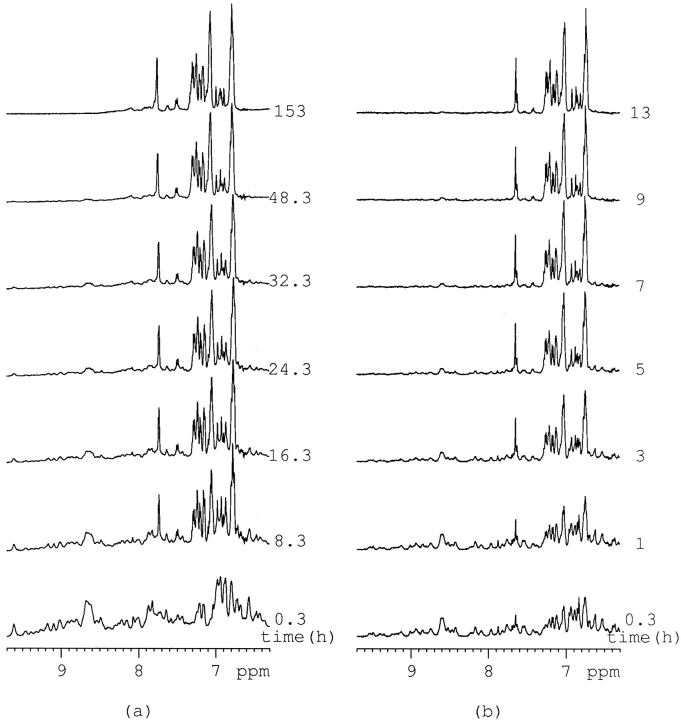
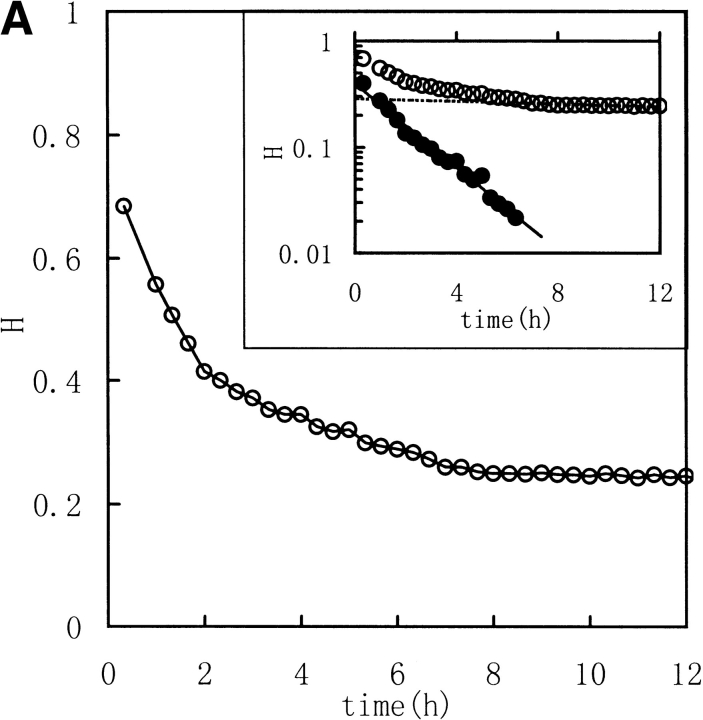
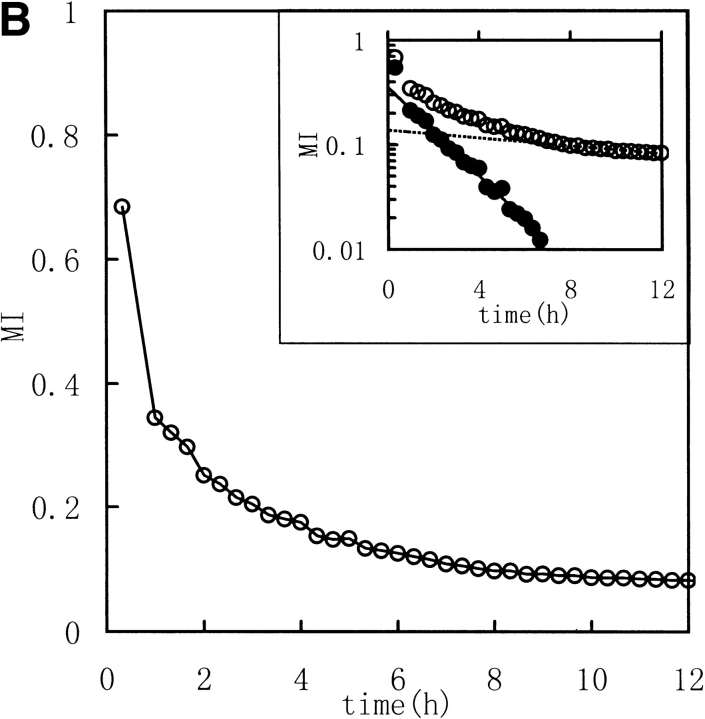
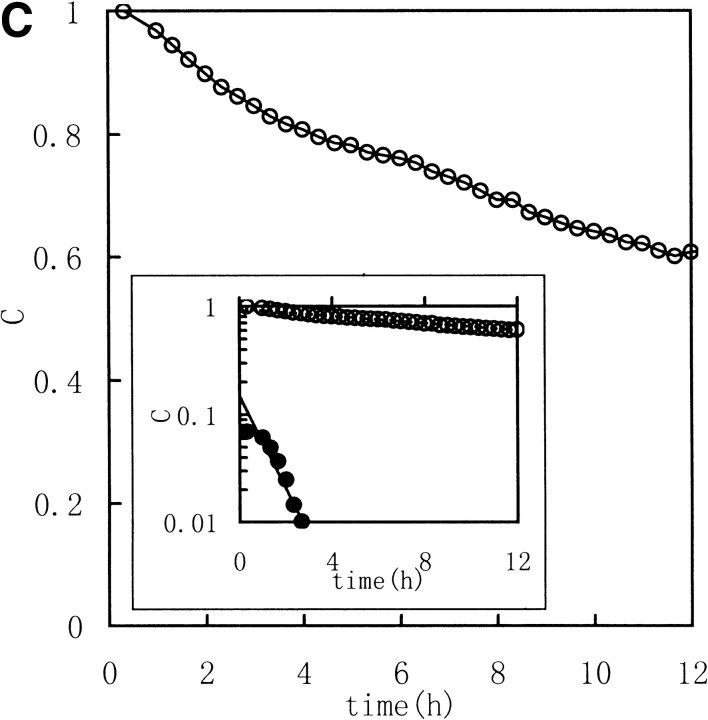
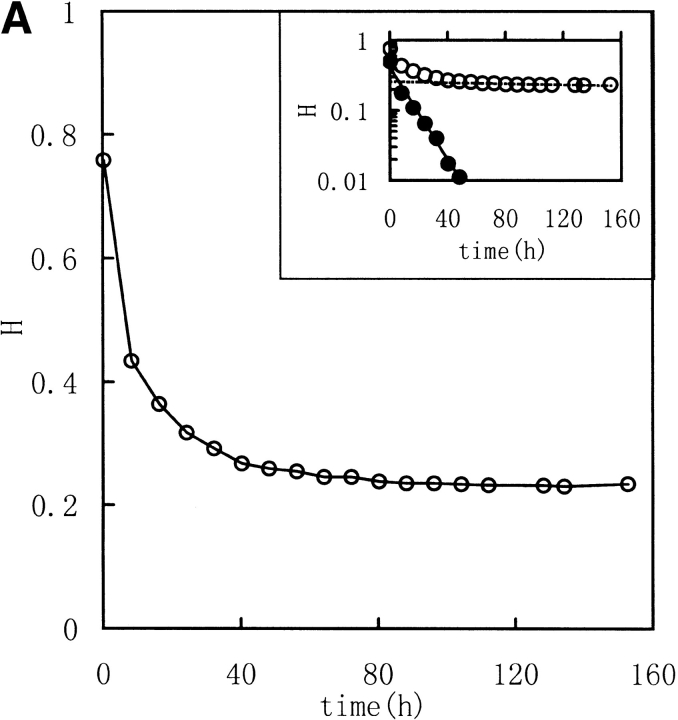
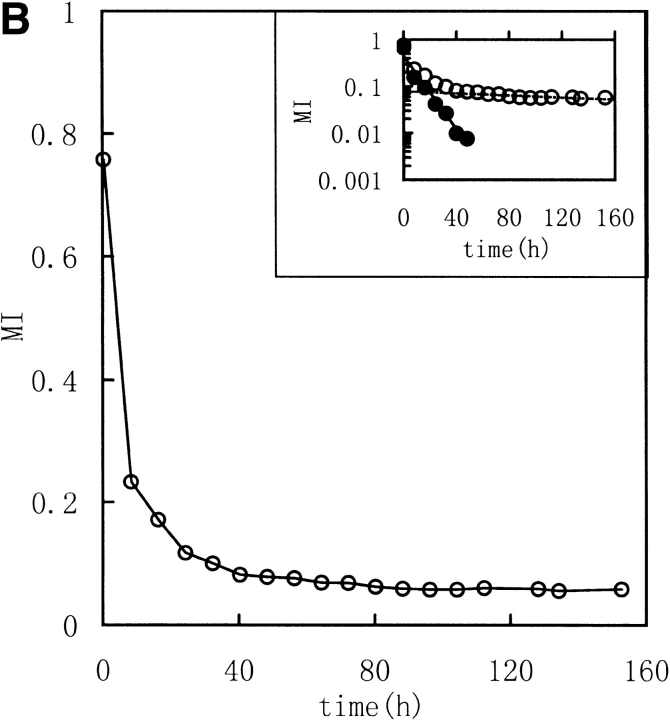
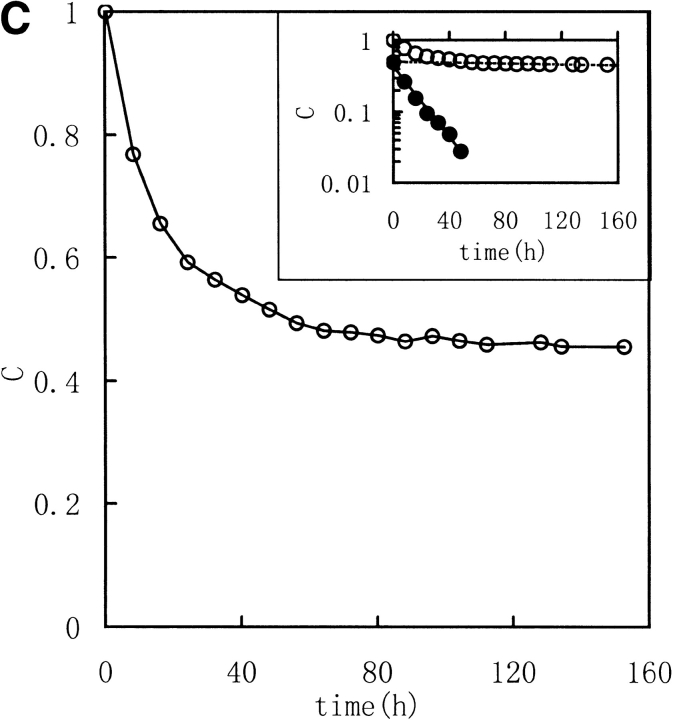
The dynamics of the unfolding process of bovine pancreatic ribonuclease A (RNase A) unfolded by dithiothreitol (DTT) at a low concentration of 1:30 were investigated in alkaline phosphate-buffered saline solutions at 303K and 313K by using proton nuclear magnetic resonance ((1)H NMR) spectra. Three NMR spectral parameters including Shannon entropy, mutual information, and correlation coefficient were introduced into the analysis. The results show that the unfolding process of RNase A was slowed to the order of many hours, and the kinetics of the unfolding pathway described by the three parameters is best fit by a model of two consecutive first-order reactions. Temperature greatly influences the rate constants of the unfolding kinetics with different temperature effects observed for the fast and the slow processes. The consistencies and the differences between the three sets of parameters show that they reflect the same relative denaturation pathway but different spectra windows of the unfolding process of RNase A. The results suggest that the unfolding process of RNase A induced by low concentrations of DTT is a two-phase pathway containing fast and slow first-order reactions.
Figures
Similar articles
-
Biphasic reductive unfolding of ribonuclease A is temperature dependent.Eur J Biochem. 2002 Nov;269(21):5314-22. doi: 10.1046/j.1432-1033.2002.03251.x. Eur J Biochem. 2002. PMID: 12392565
-
Folding and unfolding kinetics of the proline-to-alanine mutants of bovine pancreatic ribonuclease A.Biochemistry. 1996 Feb 6;35(5):1548-59. doi: 10.1021/bi952348q. Biochemistry. 1996. PMID: 8634286
-
Kinetic and thermodynamic studies of the folding/unfolding of a tryptophan-containing mutant of ribonuclease A.Biochemistry. 1996 Oct 1;35(39):12978-92. doi: 10.1021/bi961280r. Biochemistry. 1996. PMID: 8841145
-
Folding studies on ribonuclease A, a model protein.Fold Des. 1997;2(1):R1-11. doi: 10.1016/S1359-0278(97)00001-1. Fold Des. 1997. PMID: 9080194 Review.
-
Unfolding of ribonuclease A on silica nanoparticle surfaces.Nano Lett. 2007 Jul;7(7):1991-5. doi: 10.1021/nl070777r. Epub 2007 Jun 9. Nano Lett. 2007. PMID: 17559285 Review.
Cited by
-
Characterization of protein unfolding by fast cross-linking mass spectrometry using di-ortho-phthalaldehyde cross-linkers.Nat Commun. 2022 Mar 18;13(1):1468. doi: 10.1038/s41467-022-28879-4. Nat Commun. 2022. PMID: 35304446 Free PMC article.
-
Two-dimensional infrared correlation spectroscopy study of sequential events in the heat-induced unfolding and aggregation process of myoglobin.Biophys J. 2003 Sep;85(3):1959-67. doi: 10.1016/S0006-3495(03)74623-2. Biophys J. 2003. PMID: 12944308 Free PMC article.
References
-
- Adler, M. and Scheraga, H.A. 1990. Nonnative isomers of proline-93 and -114 predominate in the heat-unfolded ribonuclease A. Biochemistry 29 8211–8216. - PubMed
-
- Alexandrescu, A.T., Rathgeb-Szbo, K., Rumpel, K., Jahnke, W., Schulthess, T., and Kammerer, R. 1998. 15N backbone dynamics of the S-peptide from ribonuclease A in its free and S-protein bound forms: Toward a site-specific analysis of entropy changes upon folding. Protein Sci. 7 389–402. - PMC - PubMed
-
- Biringer, R.G. and Fink, A.L. 1982. Observation of intermediates in the folding of ribonuclease A at low temperature using proton nuclear magnetic resonance. Biochemistry 21 4748–4755. - PubMed
-
- Cavanagh, J., Fairbrother, W.J., Palmer III, A.G., and Skelton, N.J. 1995. Protein NMR spectroscopy. Academic Press, London.
-
- Jaenicke, R. and Rudolph, R. 1989. Folding proteins. In Protein structure, a practical approach. (ed. T.E. Creighton), pp. 191–224. IRL Press, New York.
Publication types
MeSH terms
Substances
LinkOut - more resources
Full Text Sources
Other Literature Sources
