Clinical Trial
. 2001 Jan;54(1):54-62.
doi: 10.1136/jcp.54.1.54.

Why oral calcium supplements may reduce renal stone disease: report of a clinical pilot study

Affiliations
Clinical Trial

Why oral calcium supplements may reduce renal stone disease: report of a clinical pilot study

C P Williams et al. J Clin Pathol. 2001 Jan.

Abstract

Aims: To investigate whether increasing the daily baseline of gut calcium can cause a gradual downregulation of the active intestinal transport of calcium via reduced parathyroid hormone (PTH) mediated activation of vitamin D, and to discuss why such a mechanism might prevent calcium oxalate rich stones. To demonstrate the importance of seasonal effects upon the evaluation of such data.

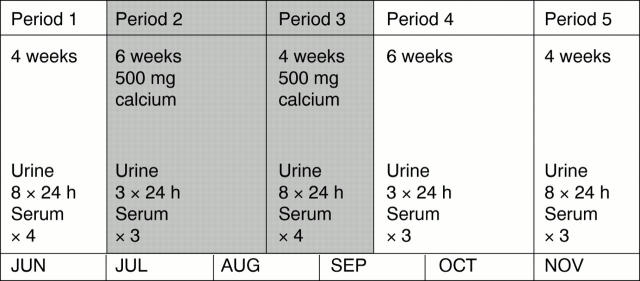
Methods: Within an intensive 24 hour urine collection regimen, daily calcium supplementation (500 mg) was given to five stone formers for a 10 week period during a six month crossover study. In a further population of patients on follow up for previous renal stone disease, observations were made on 1066 24 hour urine samples collected over five years in respect of seasonal effects relevant to the interpretation of the study.

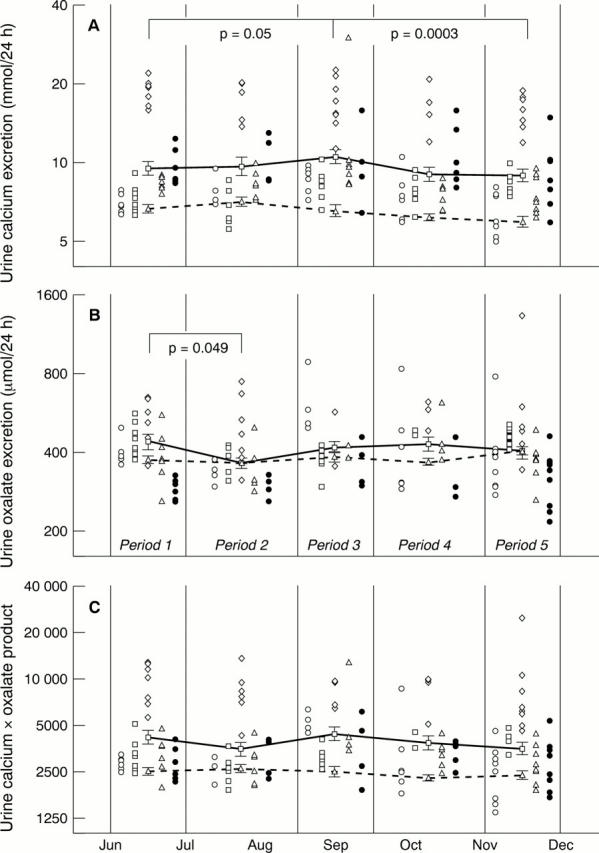
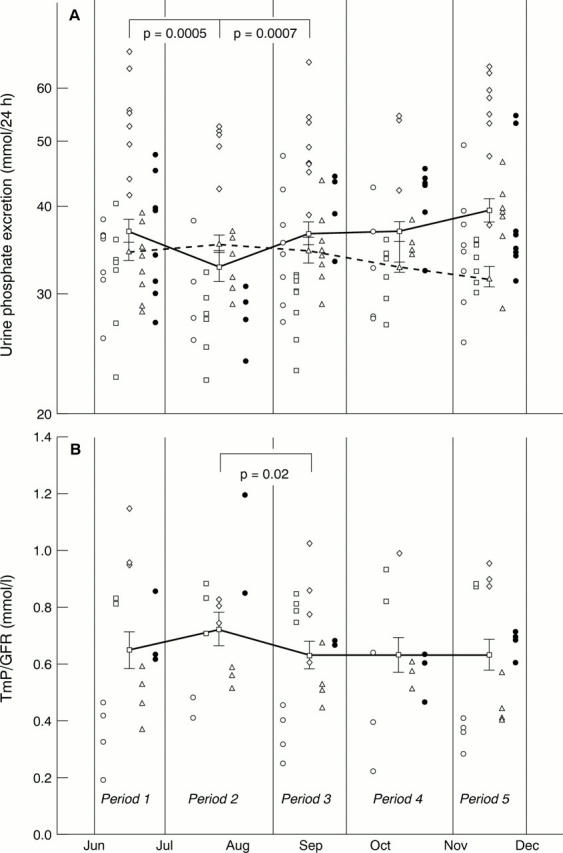
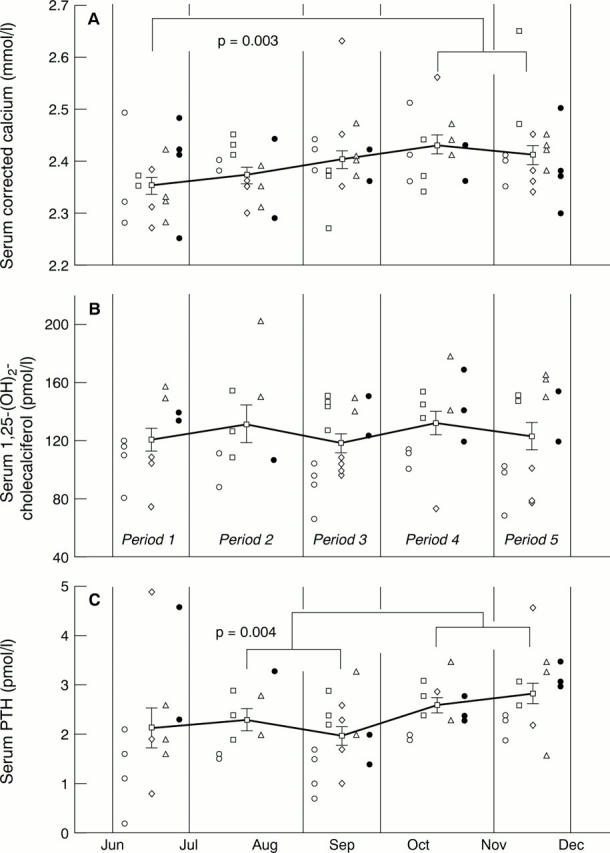
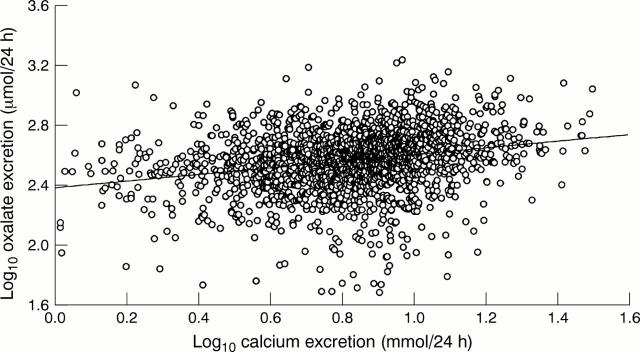
Results: In the group of patients on calcium supplements the following results were found. During calcium supplementation, the proportion of urine calcium to oxalate was higher (increased calcium to oxalate molar ratio), the 24 hour urine product of calcium and oxalate did not rise, and urine oxalate was lower during the first six weeks of supplementation. Twenty four hour urine calcium was 10.2% higher than baseline in the final four weeks of the 10 weeks of supplementation. Twenty four hour urine phosphate was 11.4% lower during the first six weeks of supplementation, but then rose while the patients were still on supplementation; renal tubular reabsorption of phosphate (TmP/GFR) mirrored the urine phosphate changes inversely. PTH was higher after stopping supplementation, but 1,25-(OH)2-cholecalciferol changes were not detected. In the 1066 urine samples collected over five years the following results were found. Calcium and oxalate excretion correlated positively and not inversely. Urine calcium and phosphate excretion were 5.5% and 2.5% higher, respectively, in "light" months of the year compared with "dark" months. A post summer decline in both urine calcium and urine phosphate was relevant to the interpretation of the study.

Conclusions: Regular calcium supplementation does not raise the product of calcium and oxalate in urine and the proportion of oxalate to calcium is reduced. The underlying mechanisms of the changes seen in phosphate, calcium, and PTH and the observations on 1,25-(OH)2-cholecalciferol are not clear. Observed changes in phosphate could possibly be part of a calcium regulating feedback loop operating over a period of weeks. In evaluating these mechanisms background seasonal effects are important. It is possible that "programming" of the gut mucosa in terms of calcium transport is a major determinant of the relation between calcium and oxalate concentrations in urine and their relative abundance. Increased oral calcium, in association with a reduction of the relative proportion absorbed, may be pertinent to the prevention of calcium oxalate rich stones.


Figures

None
Figure 1 Illustration of the trial design showing the periods when calcium supplements were given and the timing of blood and urine samples.
None
Figure 2 Patients' results showing log10 transformed values for 24 hour urine (A) calcium excretion, (B) oxalate excretion, and (C) the calcium times oxalate product excretion. The five patients' results are represented by open circles, open squares, open diamonds, open triangles, and filled circles, respectively. In the interests of clarity, individual patients' results during each stage of the trial are simply stacked one above the other, rather than being depicted chronologically. Separate patients' results are depicted side by side to assist in interpreting the data. The solid lines represent the overall mean patients' results for periods 1, 2, 3, 4, and 5 of the trial. Error bars represent 1 SE about the mean. The broken lines represent overall mean values of patients from the reference population, whose urine samples were collected during the same weeks of the year as the trial patients. Significant differences between periods are only shown for the trial patients and were calculated by two way analysis of variance, followed by the Fisher LSD test.
None
Figure 3 Pooled patients' results showing log10 transformed values for (A) 24 hour urine phosphate excretion and (B) renal tubular reabsorption of phosphate (TmP/GFR ratio). Individual patients' results are represented by open circles, open squares, open diamonds, open triangles, and filled circles, respectively. In the interests of clarity, individual patients' results during each stage of the trial are simply stacked one above the other, rather than being depicted chronologically. Separate patients' results are depicted side by side to assist in interpreting the data. The solid lines show the mean results for periods 1, 2, 3, 4, and 5 of the trial. The broken lines represent overall mean values of patients from the reference population, whose urine samples were collected during the same weeks of the year as the trial patients. Error bars represent 1 SE about the mean. Significant differences between periods are only shown for the trial patients and were calculated by two way analysis of variance, followed by the Fisher LSD test.
None
Figure 4 Pooled patients' results showing (A) serum calcium, (B) serum 1,25-(OH)2-cholecalciferol, and (C) serum parathyroid hormone (PTH). The five patients' results are represented by open circles, open squares, open diamonds, open triangles, and filled circles, respectively. In the interests of clarity, individual patients' results during each stage of the trial are simply stacked one above the other, rather than being depicted chronologically. Separate patients' results are depicted side by side to assist in interpreting the data. The solid lines show the mean results for periods 1, 2, 3, 4, and 5 of the trial. Error bars represent 1 SE about the mean. Significant differences between periods were calculated by two way analysis of variance, followed by the Fisher LSD test. For the purpose of statistical analysis, results for periods 2 and 3 (on calcium supplements) and periods 4 and 5 (off calcium supplements) were pooled.
None
Figure 5 Scatter diagram of log 24 hour urine oxalate excretion against log calcium excretion on data from a group of 1066 urine collections from patients on follow up for previous renal stone disease. The regression parameter associated with the regression line was 0.155 (95% confidence interval, 0.045 to 0.266; p = 0.006).

References

    1. Hinyokika Kiyo. 1993 Sep;39(9):785-9 - PubMed
    1. Hinyokika Kiyo. 1993 Jul;39(7):593-8 - PubMed
    1. N Engl J Med. 1994 Jun 9;330(23):1645-9 - PubMed
    1. N Engl J Med. 1994 Jun 9;330(23):1679-81 - PubMed
    1. Br J Urol. 1994 Sep;74(3):294-7 - PubMed

Publication types