

Rapid quantitative assessment of gastric corpus atrophy in tissue sections
- PMID: 11271791
- PMCID: PMC1731262
- DOI: 10.1136/jcp.54.1.63
Rapid quantitative assessment of gastric corpus atrophy in tissue sections
Abstract
Background/aims: Grading of Helicobacter pylori induced atrophic gastritis using the updated Sydney system is severely limited by high interobserver variability. The aim of this study was to set up a quantitative test of gastric corpus mucosal atrophy in tissue sections and test its reproducibility and correlation with the Sydney scores of atrophy.
Method: Mucosal atrophy was assessed in 124 haematoxylin and eosin stained corpus biopsy specimens by two experienced gastrointestinal pathologists (EB, JL) according to the updated Sydney system as none (n = 33), mild (n = 33), moderate (n = 33), or pronounced (n = 25). In each specimen, the proportions of glands, stroma, infiltrate, and intestinal metaplasia in the glandular zone were measured as volume percentages using a point counting method. The optimal point sample size, intra-observer and interobserver reproducibility, discriminative power for degrees of atrophy, and correlations with H pylori status were evaluated.
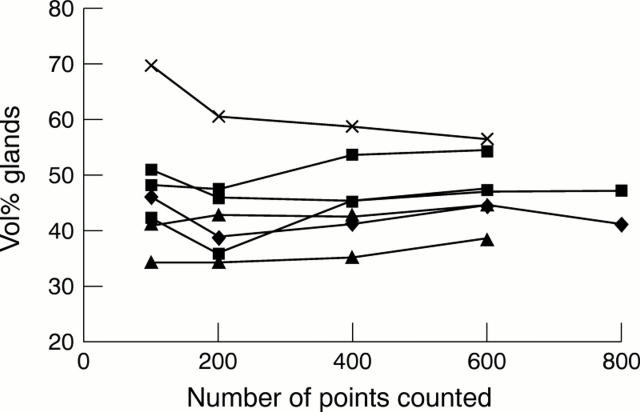
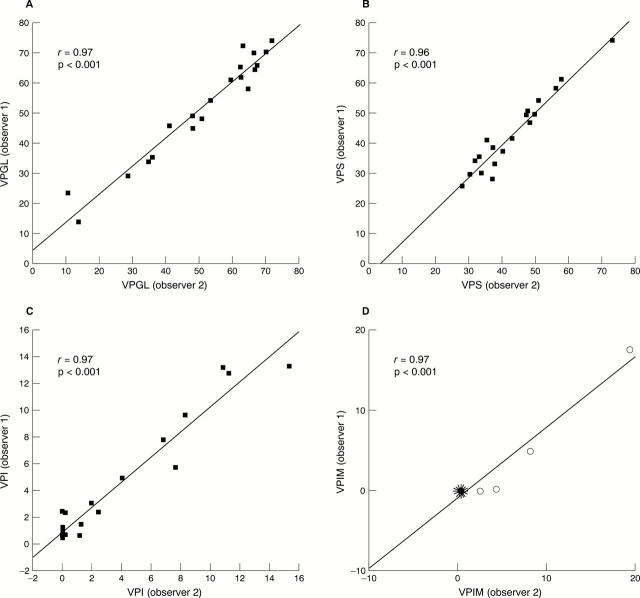
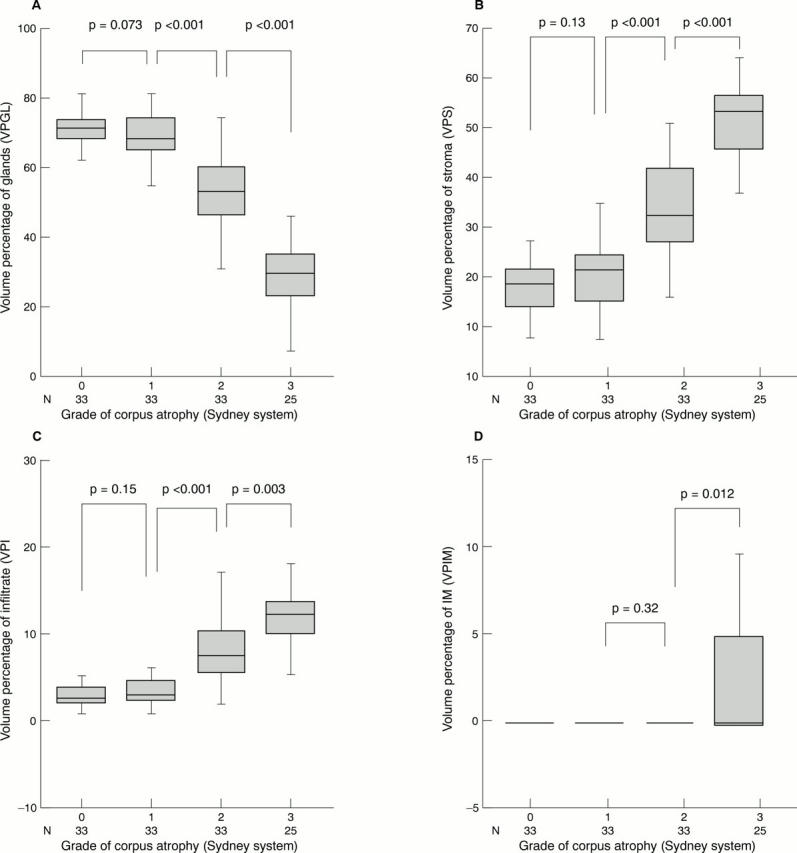
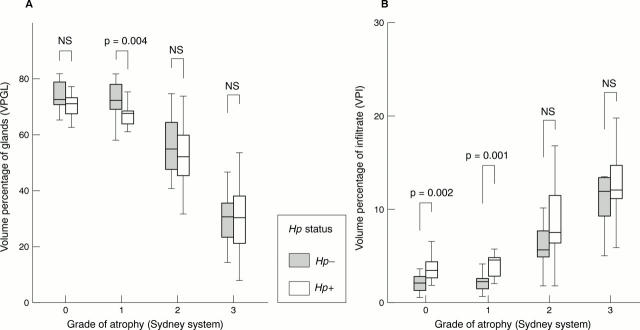
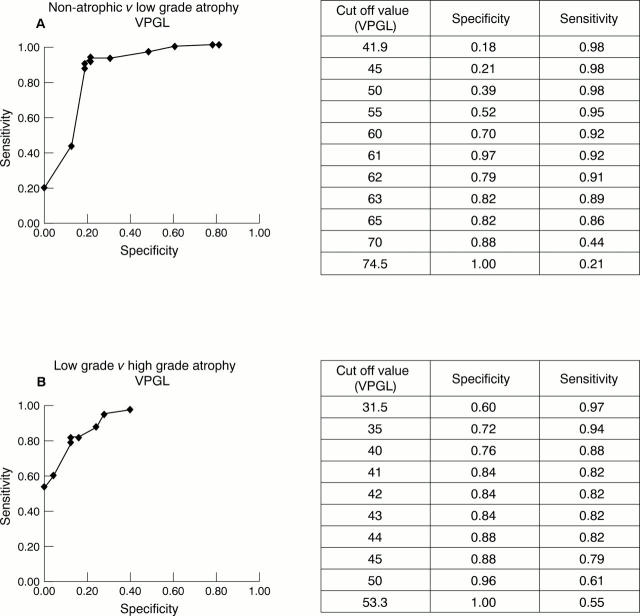
Results: Counting 400 points in 200 fields of vision provided the smallest sample size that still had excellent intra-observer and interobserver reproducibility (r > or = 0.96). Overall, the volume percentage of glands (VPGL), infiltrate (VPI), and stroma (VPS) correlated well with the Sydney scores for atrophy (p < or = 0.003). However, no differences were found between non-atrophic mucosa and mild atrophy. No correlation was found between age and either the Sydney grade of atrophy or the VPGL or VPS. In non-atrophic mucosa and mild atrophy, H pylori positive cases showed a significantly higher VPI than did H pylori negative cases. A lower VPGL was seen in H pylori positive cases than in H pylori negative cases in the mild atrophy group. VPS did not correlate with H pylori status within each grade of atrophy.
Conclusion: Point counting is a powerful and reproducible tool for the quantitative analysis of mucosal corpus atrophy in tissue sections. These data favour the combination of "none" and "mild" atrophy into one category, resulting in a three class grading system for corpus atrophy, when using the updated Sydney system.
Figures

Comment in
-
Application of quantitative techniques for the assessment of gastric atrophy.J Clin Pathol. 2001 Mar;54(3):161-2. doi: 10.1136/jcp.54.3.161. J Clin Pathol. 2001. PMID: 11253125 Free PMC article. No abstract available.
References
Publication types
MeSH terms
LinkOut - more resources
Full Text Sources
Medical