. 2001 Mar 15;15(6):687-98.
doi: 10.1101/gad.871001.

An SH2-domain-containing kinase negatively regulates the phosphatidylinositol-3 kinase pathway

Affiliations

An SH2-domain-containing kinase negatively regulates the phosphatidylinositol-3 kinase pathway

J Moniakis et al. Genes Dev. .

Abstract

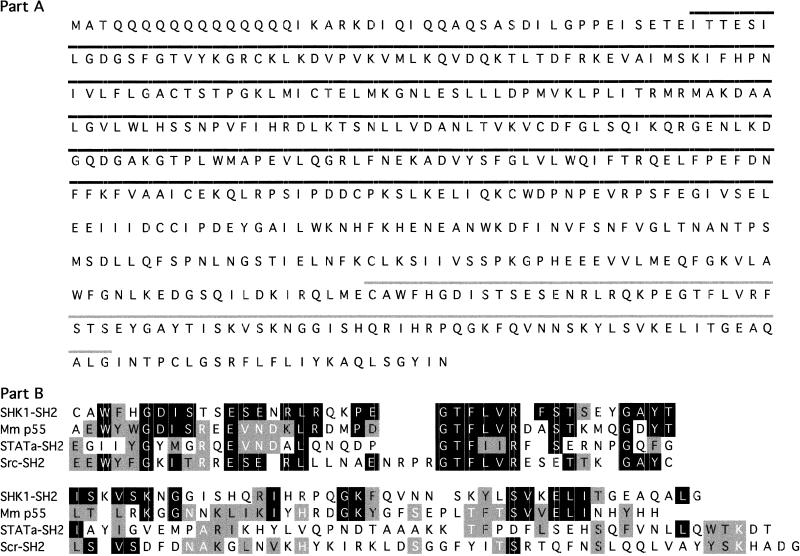
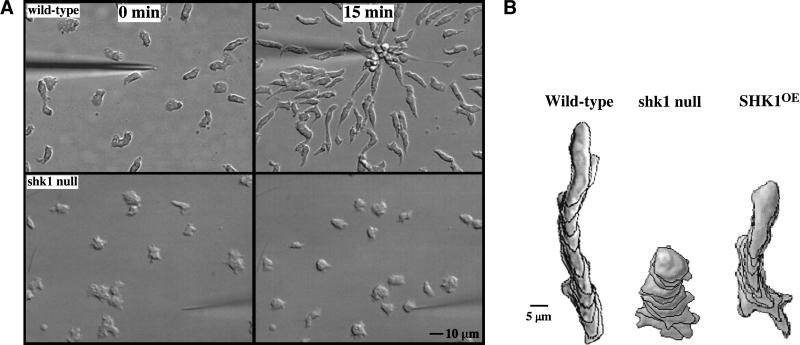
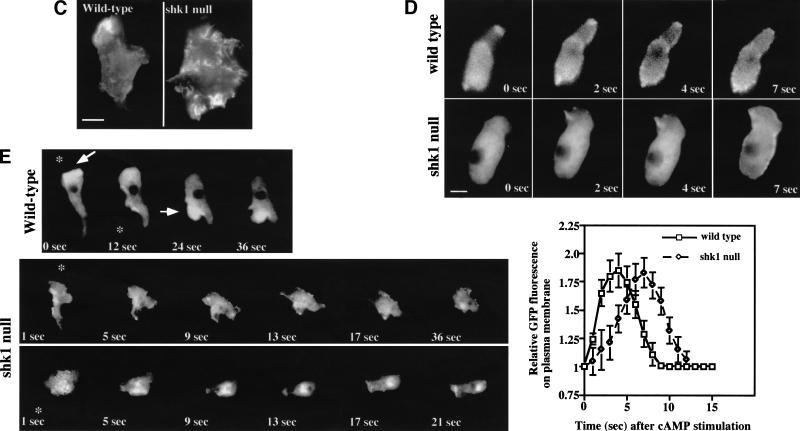
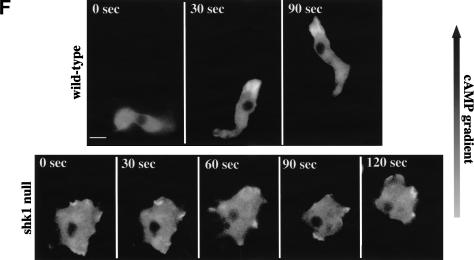
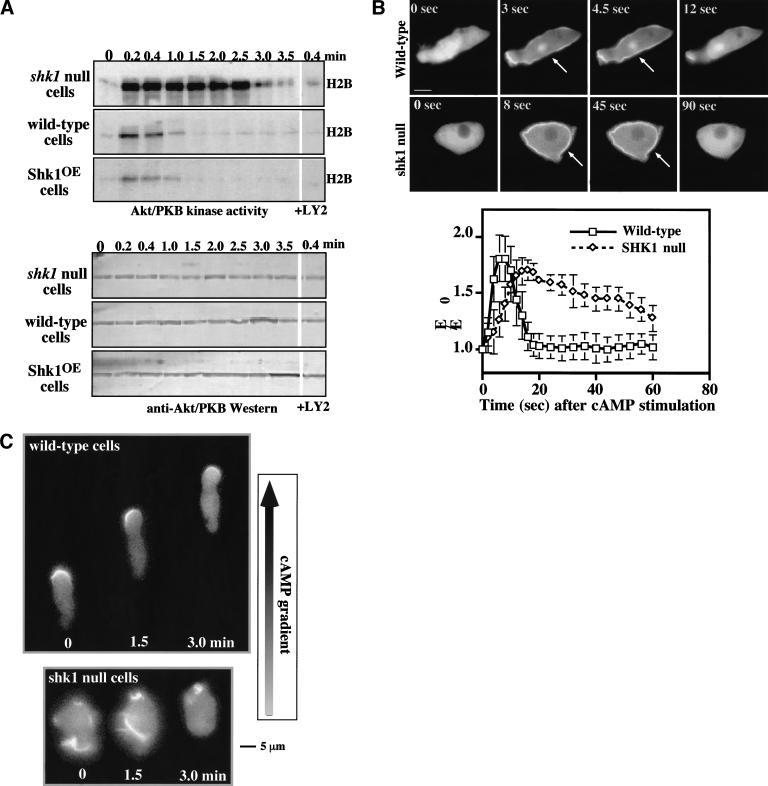
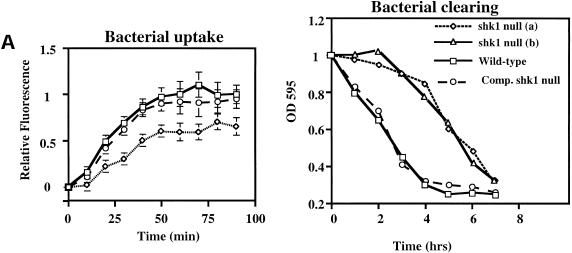
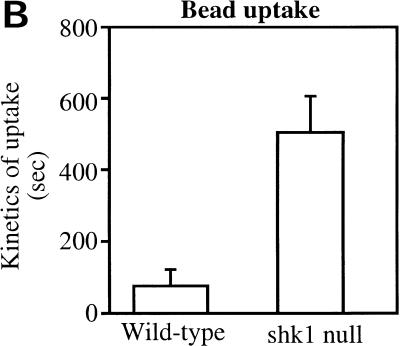
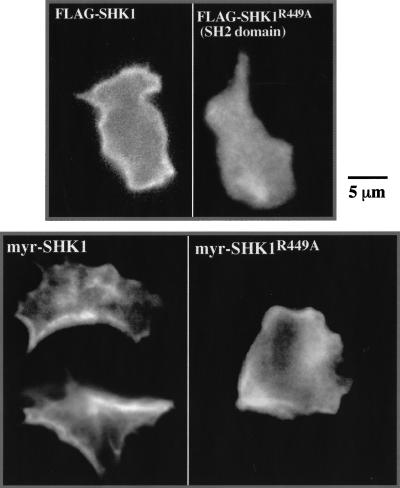
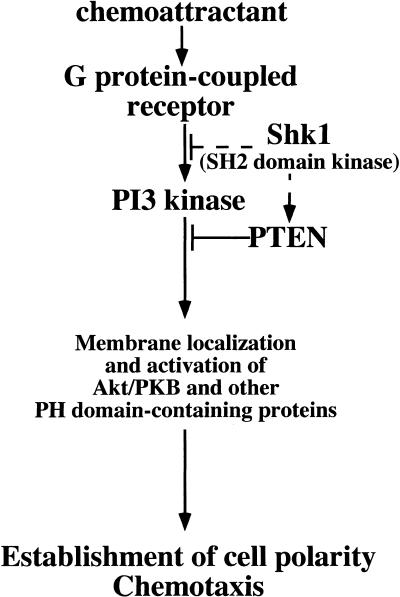
SHK1 is a novel dual-specificity kinase that contains an SH2 domain in its C-terminal region. We demonstrate that SHK1 is required for proper chemotaxis and phagocytosis. Mutant shk1 null cells lack polarity, move very slowly, and exhibit an elevated and temporally extended chemoattractant-mediated activation of the kinase Akt/PKB. GFP fusions of the PH domain of Akt/PKB or the PH-domain-containing protein CRAC, which become transiently associated with the plasma membrane after a global stimulation with a chemoattractant, remain associated with the plasma membrane for an extended period of time in shk1 null cells. These results suggest that SHK1 is a negative regulator of the PI3K (phosphatidylinositol-3 kinase) pathway. Furthermore, when a chemoattractant gradient is applied to a wild-type cell, these PH-domain-containing proteins and the F-actin-binding protein coronin localize to its leading edge, but in an shk1 null cell they become randomly associated with the plasma membrane and cortex, irrespective of the direction of the chemoattractant gradient, suggesting that SHK1 is required for the proper spatiotemporal control of F-actin levels in chemotaxing cells. Consistent with such functions, SHK1 is localized at the plasma membrane/cortex, and we show that its SH2 domain is required for this localization and the proper function of SHK1.


Figures

Figure 1
Figure 1
SHK1 primary amino acid sequence. (A) Sequence of SHK1. Putative kinase (black bar) and SH2 (gray bar) domains are indicated. (B) Sequence comparison of the SH2 domain of SHK1 with the SH2 domains of mouse p55, Q64143, human c-Src (P12931), and Dictyostelium STATa (Kawata et al. 1997).
Figure 2
Figure 2
Chemotaxis and cytoskeletal organization in shk1 null cells. (A) Aggregation-competent cells (cells competent to respond chemotactically to cAMP, see Materials and Methods) were placed on glass slides, and a micropipette source of 150 μM cAMP was placed near the cells. Chemotaxis toward the micropipette was digitally recorded. (B) The pictures are images of cells at 1-min intervals. Chemotaxis parameters were quantified with the DIAS program. For DIAS program results see Table 1. (C) Aggregation-competent cells were fixed and stained with FITC-phalloidin as described previously (Chung and Firtel 1999). F-actin assembly was visualized by fluorescence microscopy. (D) Chemotaxis-competent wild-type and shk1 null cells expressing full-length coronin–GFP fusion protein were placed on glass slides and stimulated globally with a pulse of 500 nM cAMP (final concentration). The ensuing membrane translocation in fluorescing cells was digitally recorded and quantified using the Metamorph program (Chung and Firtel 1999). (Note that the level of increase in fluorescence at the cortex is an indication of F-actin accumulation at the cell cortex and not a measure of the absolute change in F-actin in response to cAMP stimulation.) (E) Chemotaxis-competent wild-type and shk1 null cells expressing full-length coronin–GFP fusion protein were provided with a micropipette source of 150 μM cAMP (*). The micropipette location was moved at the indicated times and changes to the coronin–GFP distribution in fluorescing cells were digitally recorded. (F) Chemotaxis-competent wild-type and shk1 null cells expressing full-length coronin–GFP fusion protein were put on glass slides, and a cAMP gradient was established by placing a micropipette source of 150 μM cAMP near the cells. Chemotaxis of fluorescing cells was digitally recorded.
Figure 2
Figure 2
Chemotaxis and cytoskeletal organization in shk1 null cells. (A) Aggregation-competent cells (cells competent to respond chemotactically to cAMP, see Materials and Methods) were placed on glass slides, and a micropipette source of 150 μM cAMP was placed near the cells. Chemotaxis toward the micropipette was digitally recorded. (B) The pictures are images of cells at 1-min intervals. Chemotaxis parameters were quantified with the DIAS program. For DIAS program results see Table 1. (C) Aggregation-competent cells were fixed and stained with FITC-phalloidin as described previously (Chung and Firtel 1999). F-actin assembly was visualized by fluorescence microscopy. (D) Chemotaxis-competent wild-type and shk1 null cells expressing full-length coronin–GFP fusion protein were placed on glass slides and stimulated globally with a pulse of 500 nM cAMP (final concentration). The ensuing membrane translocation in fluorescing cells was digitally recorded and quantified using the Metamorph program (Chung and Firtel 1999). (Note that the level of increase in fluorescence at the cortex is an indication of F-actin accumulation at the cell cortex and not a measure of the absolute change in F-actin in response to cAMP stimulation.) (E) Chemotaxis-competent wild-type and shk1 null cells expressing full-length coronin–GFP fusion protein were provided with a micropipette source of 150 μM cAMP (*). The micropipette location was moved at the indicated times and changes to the coronin–GFP distribution in fluorescing cells were digitally recorded. (F) Chemotaxis-competent wild-type and shk1 null cells expressing full-length coronin–GFP fusion protein were put on glass slides, and a cAMP gradient was established by placing a micropipette source of 150 μM cAMP near the cells. Chemotaxis of fluorescing cells was digitally recorded.
Figure 3
Figure 3
Activation of PH-domain-containing proteins in wild-type and shk1 mutant cell lines. (A, upper panels) PKB activity of immunoprecipitates using H2B as a substrate is shown. Chemotaxis-competent cells were activated with cAMP and aliquots were taken at the times indicated. PKB was immunoprecipitated with a rabbit anti-Dictyostelium PKB antibody and used to phosphorylate H2B as a measure of kinase activity (Meili et al. 1999). Indicated samples were treated with the PI3K inhibitor LY294002 for 1 min prior to stimulation. (A, lower panels) Western blot analysis was performed on the immunoprecipitates using the rabbit anti-Dictyostelium PKB antibody. (B) Aggregation-competent cells expressing the full-length CRAC–GFP fusion protein were placed on glass slides and stimulated globally with 500 nM cAMP. The resulting membrane translocation in fluorescing cells was digitally recorded and quantified using the Metamorph program. (C) Aggregation-competent wild-type and shk1 null cells expressing the full-length PhdA–GFP fusion protein were put on glass slides, and a cAMP gradient was established by placing a micropipette source of 150 μM cAMP near the cells. Chemotaxing fluorescing cells were digitally recorded.
Figure 4
Figure 4
Phagocytosis in shk1 mutant cell lines. (A) Cells grown axenically in log phase were adjusted to a concentration of 1 × 106 cells/mL in a suspension of GFP-tagged E. coli. Samples were taken at the time points shown, and Dictyostelium cells were isolated by differential centrifugation. The cells were fixed, and bacterial uptake was quantified fluorometrically. The label Comp. shk1 null refers to shk1 null cells complemented with FLAG–SHK1. (B) The cells were adjusted to a concentration of 1 × 106 cells/mL in an E. coli suspension. The ability of the cells to grow on bacteria was quantified by measuring uptake and degradation of bacteria from the growth medium. (C) 1 × 105 axenically grown cells were placed on a glass slide in a suspension of Na/K phosphate buffer, and 2-μm FluoSphere beads were added to the suspension (to a final concentration of 2 × 103% solids). Bead internalization was monitored by DIC and fluorescence microscopy and digitally recorded.
Figure 4
Figure 4
Phagocytosis in shk1 mutant cell lines. (A) Cells grown axenically in log phase were adjusted to a concentration of 1 × 106 cells/mL in a suspension of GFP-tagged E. coli. Samples were taken at the time points shown, and Dictyostelium cells were isolated by differential centrifugation. The cells were fixed, and bacterial uptake was quantified fluorometrically. The label Comp. shk1 null refers to shk1 null cells complemented with FLAG–SHK1. (B) The cells were adjusted to a concentration of 1 × 106 cells/mL in an E. coli suspension. The ability of the cells to grow on bacteria was quantified by measuring uptake and degradation of bacteria from the growth medium. (C) 1 × 105 axenically grown cells were placed on a glass slide in a suspension of Na/K phosphate buffer, and 2-μm FluoSphere beads were added to the suspension (to a final concentration of 2 × 103% solids). Bead internalization was monitored by DIC and fluorescence microscopy and digitally recorded.
Figure 5
Figure 5
SHK1 localization. (A) Dictyostelium wild-type cells expressing FLAG–SHK1 and FLAG–SHK1R449A (SH2 domain mutant R449A) fusion proteins were fixed and stained with anti-FLAG antibody. FLAG–SHK1 localization was visualized by indirect immunofluorescence. (B) Dictyostelium shk1 null cells expressing myr-FLAG–SHK1 (FLAG–SHK1 with an N-terminal c-Src myristoylation site) and myr-FLAG–SHK1R449A fusion proteins were fixed and stained with anti-FLAG antibody. Note that myr-FLAG–SHK1R449A does not complement the shk1 null phenotype and that shk1 null cells are more spread and have a significant amount of random membrane ruffling and F-actin localization. This results in the abnormal-looking membrane localization of myr-FLAG–SHK1R449A.
Figure 6
Figure 6
Function of SHK1. SHK1 may operate by inhibiting PI3K activity directly or by inhibiting PI3K upstream activators. SHK1 may also activate PTEN, a downstream inhibitor of the PI3K pathway. See text for details.

References

    1. Adler K, Gerisch G, von Hugo U, Lupas A, Schweiger A. Classification of tyrosine kinases from Dictyostelium discoideum with two distinct, complete or incomplete catalytic domains. FEBS Lett. 1996;395:286–292. - PubMed
    1. Alessi D, Andjelkovic M, Caudwell B, Cron P, Morrice N, Cohen P, Hemmings B. Mechanism of activation of protein kinase B by insulin and IGF-1. EMBO J. 1996;15:6541–6551. - PMC - PubMed
    1. Alessi D, James S, Downes C, Holmes A, Gaffney P, Reese C, Cohen P. Characterization of a 3-phosphoinositide-dependent protein kinase which phosphorylates and activates protein kinase Bα. Curr Biol. 1997;7:261–269. - PubMed
    1. Andjelkovic M, Alessi DR, Meier R, Fernandez A, Lamb NJ, Frech M, Cron P, Cohen P, Lucocq JM, Hemmings BA. Role of translocation in the activation and function of protein kinase B. J Biol Chem. 1997;272:31515–31524. - PubMed
    1. Biggs WH, iii, Meisenhelder J, Hunter T, Cavenee WK, Arden KC. Protein kinase B/Akt-mediated phosphorylation promotes nuclear exclusion of the winged helix transcription factor FKHR1. Proc Natl Acad Sci USA. 1999;96:7421–7426. - PMC - PubMed

Publication types

MeSH terms