. 2001 Mar 15;15(6):710-23.
doi: 10.1101/gad.194101.

Closely related proteins MBD2 and MBD3 play distinctive but interacting roles in mouse development

Affiliations

Closely related proteins MBD2 and MBD3 play distinctive but interacting roles in mouse development

B Hendrich et al. Genes Dev. .

Abstract

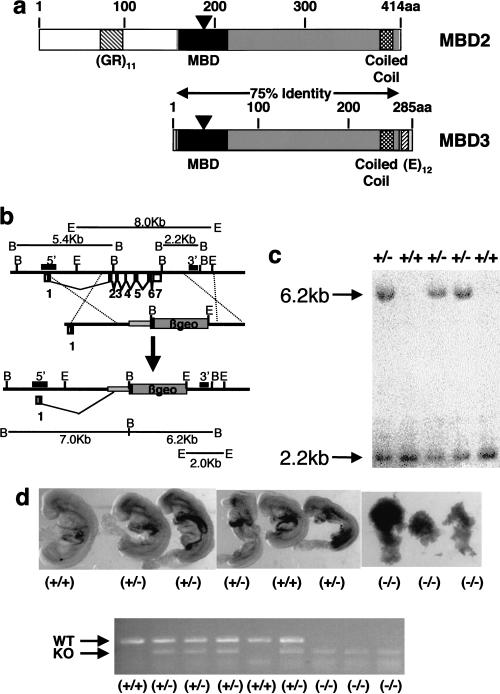
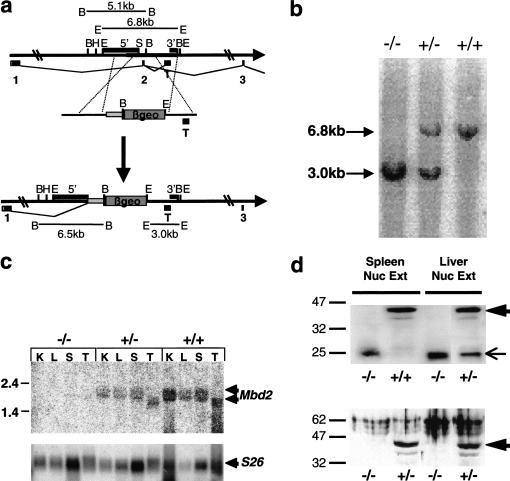
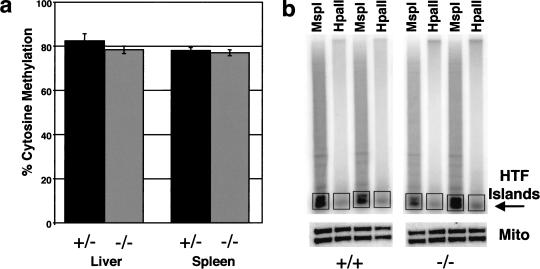
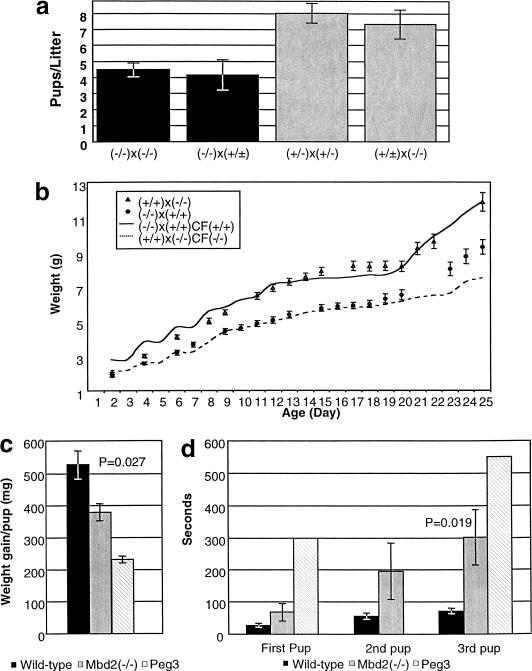
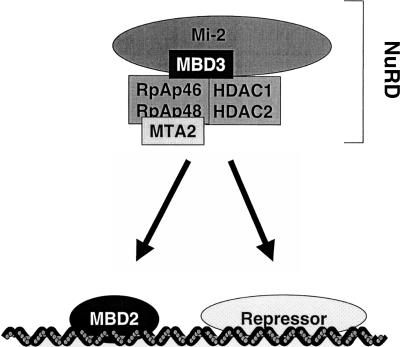
MBD2 and MBD3 are closely related proteins with consensus methyl-CpG binding domains. MBD2 is a transcriptional repressor that specifically binds to methylated DNA and is a component of the MeCP1 protein complex. In contrast, MBD3 fails to bind methylated DNA in murine cells, and is a component of the Mi-2/NuRD corepressor complex. We show by gene targeting that the two proteins are not functionally redundant in mice, as Mbd3-/- mice die during early embryogenesis, whereas Mbd2-/- mice are viable and fertile. Maternal behavior of Mbd2-/- mice is however defective and, at the molecular level, Mbd2-/- mice lack a component of MeCP1. Mbd2-mutant cells fail to fully silence transcription from exogenous methylated templates, but inappropriate activation of endogenous imprinted genes or retroviral sequences was not detected. Despite their differences, Mbd3 and Mbd2 interact genetically suggesting a functional relationship. Genetic and biochemical data together favor the view that MBD3 is a key component of the Mi-2/NuRD corepressor complex, whereas MBD2 may be one of several factors that can recruit this complex to DNA.


Figures

Figure 1
Figure 1
Targeted deletion of Mbd3. (a) Schematic diagrams of the MBD2 and MBD3 proteins. Amino acids to the right of the black triangles are not encoded by the targeted alleles. The portion shown in dark gray is 75% identical at the amino-acid level between the two proteins. The methyl-CpG–binding domains are shown as black boxes, the putative coiled-coil domains are shown as stippled boxes, and the simple sequence repeats are shown as cross-hatched boxes. (b) The exons of the Mbd3 gene are indicated below the line with coding sequences indicated as black-filled boxes. Exons 2–7 were replaced by the βgeo cassette to generate the targeted allele. Probes used in Southern blots are indicated as hatched boxes above the line labeled either 5′ or 3′, and restriction fragments used for genotyping are indicated. (B) BglII, (E) EcoRI. (c) Southern blot of BglII digested DNA derived from five mice probed with the 3′ probe indicated in part a. Genotypes of the mice are indicated at the top. (d) 8.5 d.p.c. embryos from a single litter are shown at the top, with genotypes determined by the PCR results shown below. The order of embryos is the same as that for the PCR. The top band of the PCR is derived from the wild-type allele, whereas the lower band is derived from the targeted allele. Primers are visible at the bottom of the gel.
Figure 2
Figure 2
Generation of Mbd2 targeted deletion. (a) Exon 2 of the Mbd2 gene was replaced by the promoterless βgeo cassette. Exons 1–3 are indicated below the line as is a testis-specific exon (T). Coding regions within the exons are shown in black. Restriction enzyme sites are indicated: (B) BglII, (E) EcoRI, (H) HindIII, (Sh) SphI. Probes used for Southern blots are shown as filled boxes above the line labeled either 5′ or 3′, and restriction fragments used for genotyping are indicated. (b) Southern blot of EcoRI-digested DNA derived from three littermates probed with the 3′ probe indicated in part a. (c) The Mbd2 transcript is visualized as a doublet on Northern blots of RNA from wild-type or heterozygous animals, but no Mbd2 transcript is detectable in Mbd2(−/−) animals. RNA was made from kidney (K), liver (L), spleen (S), and testis (T). The blot was stripped and rehybridized with a probe for the ribosomal S26 gene as a loading control. (d) Full-length MBD2 protein is absent in nuclear extracts derived from Mbd2(−/−) spleen or liver. The top panel was stained with the S923 antibody, which recognizes the full-length MBD2 protein (large arrow) as well as a smaller protein of ∼25 kD (small arrow), which is derived from the targeted allele. The bottom panel is stained with the R593 antibody, and the location of the full-length MBD2 protein is indicated with a large arrow. Protein size markers are indicated in kilodaltons.
Figure 3
Figure 3
Normal levels of DNA methylation in Mbd2(−/−) animals. (a) The level of CpG methylation at MboI cut sites was determined in liver and spleen DNA derived from heterozygous (+/−) and Mbd2-deficient (−/−) animals and expressed as a percentage of total CpG (±s.e.). (b) Tail DNA from Mbd2-mutant (−/−) or wild-type (+/+) mice was digested with either MspI or HpaII, end-labeled with 32P, and fractionated on an agarose gel. The HTF island fraction is indicated, and the region of each lane used for quantitation is boxed. A portion of each digest was Southern blotted and probed with a mitochondrial DNA sequence as a digestion control.
Figure 4
Figure 4
Impaired nurturing behavior in Mbd2(−/−) mothers. (a) The histogram plots average litter sizes for the crosses indicated below. Genotypes refer to the Mbd2 locus. Shaded in black are litters born to Mbd2(−/−) mothers and gray for litters born to heterozygous or wild-type mothers. (b) The average weight from a litter of eight pups ±s.e. is plotted on the Y-axis, and age in days is plotted on the X-axis. Pups born to a wild-type mother crossed with a Mbd2(−/−) father are plotted as open triangles, and pups born to a Mbd2(−/−) mother and wild-type father are plotted as black circles. The average weight curve from a litter of six pups born to a Mbd2(−/−) mother and wild-type father, but fostered to a wild-type mother [(−/−) × (+/+)CF(+/+)] is plotted as a solid line, while the average weight of pups born to a wild-type mother and Mbd2(−/−) father fostered to a Mbd2(−/−) mother [(+/ +) × (-/-)CF(−/−)] are indicated as a dashed line. (c) Average 24-h weight gain per pup after a 2-h separation from the mother. Mean ±s.e. is plotted in black for pups born to wild-type mothers, gray for pups born to Mbd2(−/−) mothers, and hatched for Peg3-deficient mothers (Li et al. 1999). The P value was determined using a two-tailed t test. (d) Time, in seconds, required for mothers to retrieve pups to their nests. Plotted is the mean ±s.e. for wild-type mothers in black and Mbd2(−/−) mothers in gray. Also included as hatched boxes are the results reported for Peg3-deficient mothers (Li et al. 1999). The difference in time required to retrieve all three pups is statistically significant (two-tailed t-test).
Figure 5
Figure 5
MBD2 requirement for MeCP1 formation. (a) MeCP1 from liver nuclear extracts is visualized as two different complexes (I and II) in a band shift assay using the methylated form of the probe CG11 (MeCG11). Lanes 13, wild-type nuclear extract; lanes 46, Mbd2(−/−) nuclear extract. Complex I is the major band produced in wild-type nuclei (lanes 13) but is absent in Mbd2(−/−) nuclei (lanes 46). An MBD2-specific antibody (S923) was added to lanes 2 and 5, while an antibody that recognizes both MBD2 and MBD3 (R593) was added to lanes 3 and 6. (b) Three complexes (I, II, and III) are visible in nuclear extracts derived from fibroblasts, although complex III is obscured in lanes 13 by the intensity of complex II. As in part a, complex I is absent in the Mbd2(−/−) extracts. The R593 antibody produces a specific shift of complex I in wild-type nuclear extract (lanes 23), but no shift is observed in nuclear extracts derived from Mbd2(−/−) fibroblasts (lanes 5,6).
Figure 6
Figure 6
MBD2 is required for full repression of methylated templates. The amount of luciferase activity recovered from a methylated plasmid is expressed as a percentage of that recovered from an unmethylated plasmid (Mean ±s.e.). The names and genotypes of the cell lines used are indicated below the histograms. (a) MBD2-deficient cell lines fail to fully repress the SV40 early promoter or the murine phosphoglycerate kinase (Pgk) promoter when fully methylated. (b) Repression of the methylated SV40 early promoter is restored in the Mbd2(−/−) cell lines by cotransfection of plasmids producing either full-length MBD2 or MBD2(153–414). Repression is not restored by expression of MBD2(163–414) protein, full-length MBD3 or short-form MBD3 proteins, none of which selectively bind methylated DNA in vivo. Proteins encoded by the expression constructs are diagrammed to the right of the histogram.
Figure 7
Figure 7
Proposed relationship between MBD2 and MBD3 via NuRD and MeCP1 complexes. The known components of the NuRD complex are shown, including the MBD3 protein. This complex may interact with a variety of sequence-specific DNA binding proteins to cause transcriptional repression, MBD2 being one of these. This combination of NuRD and MBD2 may be synonymous with the MeCP1 complex.

References

    1. Ahringer J. NuRD and SIN3 histone deacetylase complexes in development. Trends Genet. 2000;16:351–356. - PubMed
    1. Amir RE, Van Den Veyver IB, Wan M, Tran CQ, Francke U, Zoghbi HY. Rett syndrome is caused by mutations in X-linked MECP2, encoding methyl-CpG-binding protein 2. Nat Genet. 1999;23:185–188. - PubMed
    1. Antequera F, Macleod D, Bird AP. Specific protection of methylated CpGs in mammalian nuclei. Cell. 1989;58:509–517. - PubMed
    1. Bartolomei MS, Tilghman SM. Genomic imprinting in mammals. Annu Rev Genet. 1997;31:493–525. - PubMed
    1. Bhattacharya SK, Ramchandani S, Cervoni N, Szyf M. A mammalian protein with specific demethylase activity for mCpG DNA. Nature. 1999;397:579–583. - PubMed

Publication types

MeSH terms