. 2001 Mar 27;98(7):3778-83.
doi: 10.1073/pnas.051614498.

Computational method to reduce the search space for directed protein evolution

Affiliations

Computational method to reduce the search space for directed protein evolution

C A Voigt et al. Proc Natl Acad Sci U S A. .

Abstract

We introduce a computational method to optimize the in vitro evolution of proteins. Simulating evolution with a simple model that statistically describes the fitness landscape, we find that beneficial mutations tend to occur at amino acid positions that are tolerant to substitutions, in the limit of small libraries and low mutation rates. We transform this observation into a design strategy by applying mean-field theory to a structure-based computational model to calculate each residue's structural tolerance. Thermostabilizing and activity-increasing mutations accumulated during the experimental directed evolution of subtilisin E and T4 lysozyme are strongly directed to sites identified by using this computational approach. This method can be used to predict positions where mutations are likely to lead to improvement of specific protein properties.


Figures

Figure 1
Figure 1
The probability distribution p(c) that a positive mutation occurs at a residue with c coupled interactions. The distribution is shown at two fitness values as the sequence ascends the fitness landscape, F = 0.0 (○) and F = 17.0 (▴). Data shown are for N = 50, b = 10.0, and 50 coupling interactions. The coupling is symmetric so two residues are affected for each interaction.
Figure 2
Figure 2
The predicted sequence entropy profile (black line) and solvent accessibility (red line) for subtilisin E. If all amino acids are equally likely, then si = ln A ≈ 3.0. The solvent accessibility is the percent side chain surface area exposed, as calculated by the Lee and Richards method with a solvent radius of 1.4 Å (41).
Figure 3
Figure 3
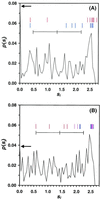
The probability distribution of site entropies p(si) for subtilisin E and T4 lysozyme. The bar indicates the mean and standard deviation of the distribution. The fraction of frozen residues are 0.078 and 0.039, as indicated by the arrows. The site entropies of positions where experimental directed evolution found positive mutations are indicated by the lines. (A) Mutations found from the in vitro evolution of subtilisin. (Top) Mutations made when the screen was to improve thermostability while retaining activity (6). From left to right, the positions (entropies) are 181 (0.36), 166 (0.96), 118 (2.37), 76 (2.45), 14 (2.50), 218 (2.54), 9 (2.55), 194 (2.59), and 161 (2.69). (Bottom) Mutations made when the screen was to improve activity toward s-AAPF-pNa in the organic solvent dimethyl formamide (33, 34). From left to right, the positions (entropies) are 181 (0.36), 107 (1.62), 182 (1.81), 206 (1.94), 156 (2.19), 131 (2.43), 188 (2.50), 218 (2.54), 255 (2.54). Note that residues 181 and 218 are common to both data sets (different amino acid substitutions were made at residue 181, whereas the same substitution was made at 218). In both studies, the mutations were found by screening 2,000–5,000 mutants generated with an average mutation rate of 2–3 nucleotide substitutions. (B) Mutations found during the evolution of T4 lysozyme (35). The red bars indicate mutations that improved stability, blue bars indicate mutations that improved activity, and purple bars indicate mutations that improved both properties. From left to right, the positions (entropies) are 153 (0.55), 26 (1.03), 151 (1.53), 22 (1.66), 41 (1.91), 16 (2.02), 147 (2.10), 119 (2.11), 163 (2.49), 116 (2.50), 93 (2.52), 113 (2.54), 40 (2.54), and 14 (2.59).
Figure 4
Figure 4
The structure of subtilisin E showing the entropy at each position. The yellow residues are the most variable sites (2.16 < s < 3.00, greater than one standard deviation above the mean), the red residues are moderately variable (1.31 < s < 2.16, between the mean and one standard deviation), and the gray residues have below average variability (s < 1.31). Site saturation experiments should be directed at yellow positions, whereas the contiguous yellow–red regions lend themselves to cassette mutagenesis. Figure generated by using molmol (40).

References

    1. Moore J C, Arnold F H. Nat Biotechnol. 1996;14:458–467. - PubMed
    1. Miyazaki K, Wintrode P, Grayling R, Rubingh D, Arnold F H. J Mol Biol. 2000;297:1015–1026. - PubMed
    1. Street A G, Mayo S L. Structure (London) 1999;7:R105–R109. - PubMed
    1. Dahiyat B I, Mayo S L. Science. 1997;278:82–87. - PubMed
    1. Malakaukas S M, Mayo S L. Nat Struct Biol. 1998;5:470–475. - PubMed

Publication types

LinkOut - more resources