. 2001 Mar 27;98(7):3843-8.
doi: 10.1073/pnas.061036798.

Analysis of transforming activity of human synovial sarcoma-associated chimeric protein SYT-SSX1 bound to chromatin remodeling factor hBRM/hSNF2 alpha

Affiliations

Analysis of transforming activity of human synovial sarcoma-associated chimeric protein SYT-SSX1 bound to chromatin remodeling factor hBRM/hSNF2 alpha

M Nagai et al. Proc Natl Acad Sci U S A. .

Abstract

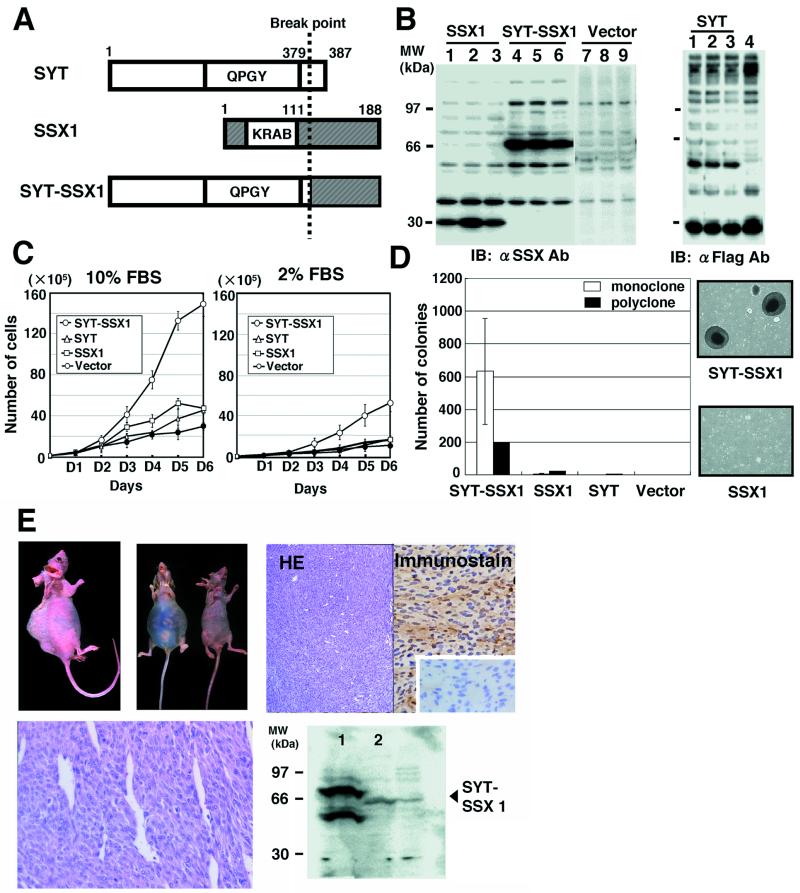
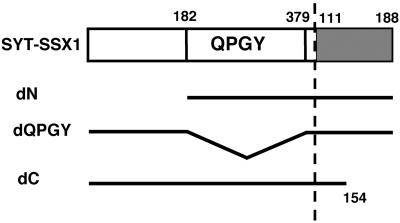
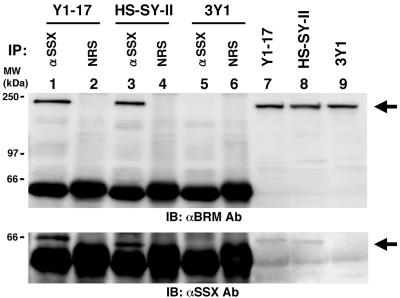
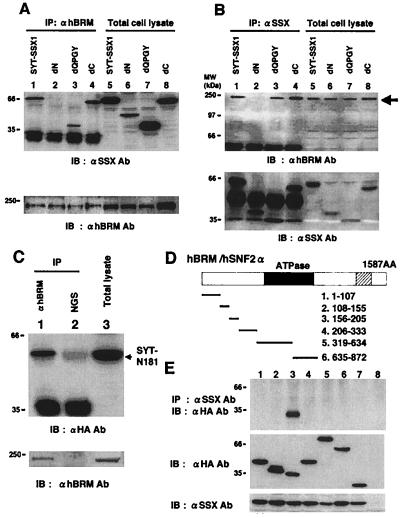
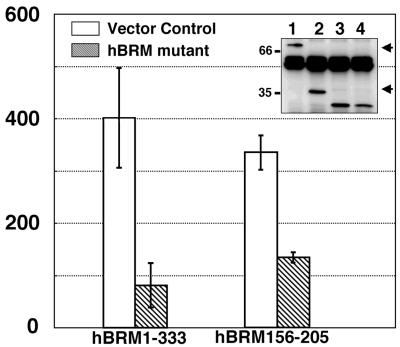
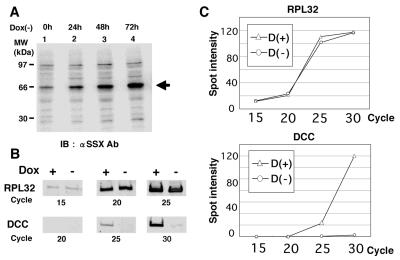
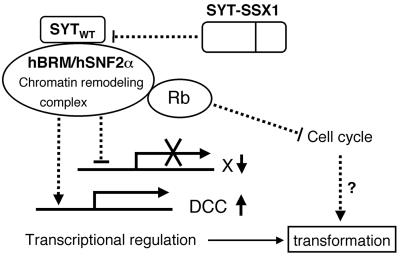
Human synovial sarcoma has been shown to exclusively harbor the chromosomal translocation t(X;18) that produces the chimeric gene SYT-SSX. However, the role of SYT-SSX in cellular transformation remains unclear. In this study, we have established 3Y1 rat fibroblast cell lines that constitutively express SYT, SSX1, and SYT-SSX1 and found that SYT-SSX1 promoted growth rate in culture, anchorage-independent growth in soft agar, and tumor formation in nude mice. Deletion of the N-terminal 181 amino acids of SYT-SSX1 caused loss of its transforming activity. Furthermore, association of SYT-SSX1 with the chromatin remodeling factor hBRM/hSNF2 alpha, which regulates transcription, was demonstrated in both SYT-SSX1-expressing 3Y1 cells and in the human synovial sarcoma cell line HS-SY-II. The binding region between the two molecules was shown to reside within the N-terminal 181 amino acids stretch (aa 1--181) of SYT-SSX1 and 50 amino acids (aa 156--205) of hBRM/hSNF2 alpha and we found that the overexpression of this binding region of hBRM/hSNF2 alpha significantly suppressed the anchorage-independent growth of SYT-SSX1-expressing 3Y1 cells. To analyze the transcriptional regulation by SYT-SSX1, we established conditional expression system of SYT-SSX1 and examined the gene expression profiles. The down-regulation of potential tumor suppressor DCC was observed among 1,176 genes analyzed by microarray analysis, and semi-quantitative reverse transcription--PCR confirmed this finding. These data clearly demonstrate transforming activity of human oncogene SYT-SSX1 and also involvement of chromatin remodeling factor hBRM/hSNF2 alpha in human cancer.


Figures

Figure 1
Figure 1
Transforming activity of SYT-SSX1-expressing 3Y1 cells. (A) Schematic structure of the SYT, SSX1, and SYT-SSX1 proteins. The break point of chromosomal translocation for chimeric gene production is indicated by a broken line. (B) Stable expression of SSX1, SYT-SSX1, and SYT in 3Y1 cells. (Left) Expression levels of SSX1 (lane 1, clone F1–7; lane 2, F1–10; lane 3, F1–23) and of SYT-SSX1 (lane 4, Y1–8; lane 5, Y1–17; lane 6, Y1–24) and vector alone (lanes 7–9) analyzed by anti-SSX antibody. (Right) SYT expression (lane 1, clone SYT-1; lane 2, SYT-2; lane 3, SYT-4; lane 4, vector) by anti-Flag Ab. (C) Growth rates of each SSX1-, SYT-SSX1-, and SYT-expressing cell lines in culture with 10% (Left) and 2% (Right) serum. The averages of cell numbers of three independent clones were plotted and standard deviations are indicated as vertical bars. (D) Analysis of anchorage-independent growth of SYT-SSX1-expressing cells. The averages of colony numbers sized larger than 0.2 mm of three independent clones of each SSX1-, SYT-SSX1-, and SYT-expressing cells were plotted as open bar graphs with standard deviations indicated as vertical bars. SSX1, SYT-SSX1, and SYT-expression vectors were transfected to 3Y1 cells and after selected by G418, resistant clones were plated as polyclonal state, and the number of the formed colonies were measured. Photographs of representative colonies are shown on the right. (E) Tumor growth in nude mice. SYT-SSX1-expressing 3Y1 cells formed tumor masses at the back and in the peritoneal cavity of nude mice (Upper Left). Expression levels of SYT-SSX1 in formed tumors were confirmed by immunostaining (Upper Right) and immunoblotting (Lower Right). Microscopic appearance of tumors is shown by hematoxylin-eosin staining (Lower Left).
Figure 2
Figure 2
Schematic structure of deletion mutants of SYT-SSX1. Open frames represent the SYT-derived region and shaded frames the SSX-derived region. Numbers indicate the amino acid position of each particular molecule.
Figure 3
Figure 3
Association of SYT-SSX1 with hBRM/hSNF2α in SYT-SSX1-expressing 3Y1 cells (clone Y1–17) and in the HS-SY-II human synovial sarcoma cell line. Immunoprecipitation of hBRM/hSNF2α by anti-SSX antibody using nuclear extracts from clone Y1–17 (lanes 1 and 2), HS-SY-II (lanes 3 and 4), and 3Y1 (lanes 5 and 6). Immunoprecipitants were probed with anti-hBRM antibody (Upper) or anti-SSX antibody (Lower). NRS stands for normal rabbit serum as a control. Nuclear extracts containing 200 μg of proteins were applied for immunoprecipitation. Lanes 7–9: 20 μg of nuclear extracts per lane of indicated cells were applied for immunoblotting.
Figure 4
Figure 4
Analysis of the binding regions of SYT-SSX1 and hBRM/hSNF2α in 293T cells. (A) SYT-SSX1 and its three deletion mutants (Fig. 2) expressed in 293T cells were immunoprecipitated with anti-hBRM/hSNF2α antibody and probed with anti-SSX antibody (Upper, lanes 1–4). Expression levels of SYT-SSX1 and its mutants were examined by immunoblotting (Upper, lanes 5–8). Immunoprecipitants and total cell lysates were also probed with anti-hBRM antibody (Lower). Lysates with 200 μg of proteins were used for immunoprecipitation and 20 μg of total cell lysates were applied for immunoblotting. (B) 293T cell lysates expressing SYT-SSX1 and its mutants were immunoprecipitated with anti-SSX antibody and probed with anti-hBRM antibody (Upper, lanes 1–4) or with anti-SSX antibody (Lower, lanes 1–4). Protein expression levels of endogenous hBRM/hSNF2α (Upper, lanes 5–8) and SYT-SSX1 and its mutants (Lower, lanes 5–8) are displayed. (C) Association of hBRM/hSNF2α with N terminus 181 amino acids of SYT. pcDNA3- HA-GFP-SYT-N181 was transfected to 293T cells and total cell lysates were immunoprecipitated with anti-BRM antibody (lane 1) or normal goat serum (NGS; lane 2) and probed with anti-HA antibody. Expression levels of SYT-N181 are shown in lane 3. Immunoprecipitants and total cell lysates were also probed with anti-hBRM antibody (Lower). (D) Schematic structure of hBRM/hSNF2α and its mutants. The closed frame represents ATPase domain and the shaded frame bromo domain. The number of amino acids comprising six mutants are described. (E) Analysis of the binding region of hBRM/hSNF2α to SYT-SSX1. Six mutants of hBRM were tagged with HA-GFP, coexpressed with SYT-SSX1, and SYT-SSX1 was immunoprecipitated by anti-SSX antibody and probed with anti-HA tag antibody to detect coprecipitated mutants of hBRM/hSNF2α (Top). Confirmations of expression levels of hBRM-derived mutants and SYT-SSX1 are shown in the Middle and Bottom. Lanes 1 to 6 correspond to the number of mutants described above. Lane 7, HA-GFP; lane 8, empty vectors.
Figure 5
Figure 5
Suppression of anchorage-independent growth of SYT-SSX1-expressing 3Y1 cells by dominant negative form of hBRM/hSNF2α. Either hBRM1–333 or hBRM156–205 was transfected in SYT-SSX1-expressing 3Y1 cells (clone Y1–17) together with pBabe-hygo; and after drug selection colony formation assay was performed. The average numbers of formed colonies are shown as bar graphs with standard deviation. The protein expression levels confirmed by immunoprecipitation and immunoblotting by using anti-HA are also displayed. Lane 1, hBRM1–333; lane 2, hBRM156–205; lane 3, HA-GFP as control for hBRM1–333; lane 4, HA-GFP as control for hBRM156–205. Arrowheads indicate two hBRM mutants.
Figure 6
Figure 6
Analysis of gene expression profiles regulated by SYT-SSX1. (A) Establishment of the conditionally inducible system of SYT-SSX1 in 3Y1 cells by the tetracycline-off system. Expression levels of SYT-SSX1 were examined by immunoblotting of total cell lysates of 3Y1 cells after withdrawal of 50 ng/ml of doxycycline. Duration of induction is indicated above the lane numbers. (B and C) Semiquantitative RT-PCR analysis of expression levels of DCC. mRNAs were extracted from 3Y1 cells without induction [Dox(+)] and 48 h after induction [Dox(−)] of SYT-SSX1. After RT reaction, cDNAs of housekeeping ribosomal gene RPL32 or DCC were amplified by PCR at the cycles indicated below. (B) PCR products were loaded on agarose gel and stained with syber green. (C) The intensities of the bands were measured by an image reader (FLA2000, Fuji) and plotted as graphs. These experiments were repeated independently three times.
Figure 7
Figure 7
Putative mechanism of SYT-SSX-induced transformation. SYT-SSX may disturb the function of hBRM/hSNF2α possibly bound to wild-type SYT and lead to transforming phenotype.

References

    1. Enzinger F M, Weiss S W. Soft Tissue Tumors. St. Louis: Mosby; 1988.
    1. Turc-Carel C, Dal Cin P, Limon J, Rao U, Li F P, Corson J M, Zimmerman R, Parry D M, Cowan J M, Sandberg A A. Proc Natl Acad Sci USA. 1987;84:1981–1985. - PMC - PubMed
    1. Wang-Wuu S, Soukop S W, Lange B J. Cancer Genet Cytogenet. 1987;29:179–181. - PubMed
    1. Nojima T, Wang Y S, Abe S, Matsuno T, Yamawaki S, Nagashima K. Acta Pathol Jpn. 1990;40:486–493. - PubMed
    1. Knight J C, Reeves B R, Kearney L, Monaco A P, Lehrach H, Cooper C S. Int J Oncol. 1992;1:747–752. - PubMed

Publication types

MeSH terms

LinkOut - more resources