. 2001 Mar 27;98(7):4130-5.
doi: 10.1073/pnas.071056298.

Efficient use of a small genome to generate antigenic diversity in tick-borne ehrlichial pathogens

Affiliations

Efficient use of a small genome to generate antigenic diversity in tick-borne ehrlichial pathogens

K A Brayton et al. Proc Natl Acad Sci U S A. .

Abstract

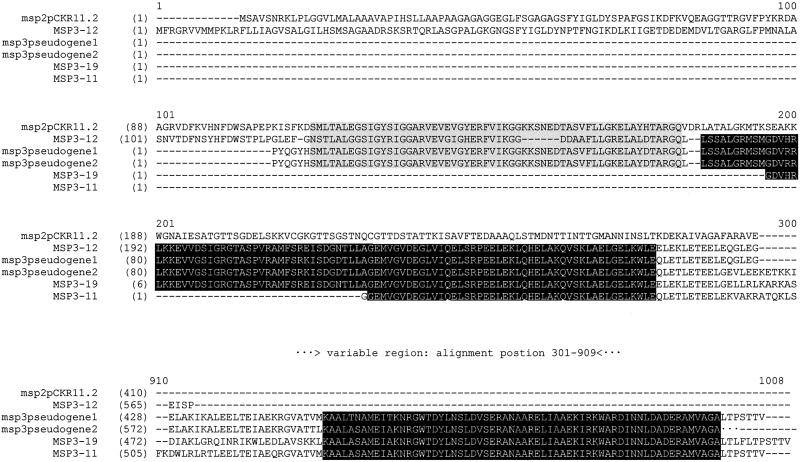
Ehrlichiae are responsible for important tick-transmitted diseases, including anaplasmosis, the most prevalent tick-borne infection of livestock worldwide, and the emerging human diseases monocytic and granulocytic ehrlichiosis. Antigenic variation of major surface proteins is a key feature of these pathogens that allows persistence in the mammalian host, a requisite for subsequent tick transmission. In Anaplasma marginale pseudogenes for two antigenically variable gene families, msp2 and msp3, appear in concert. These pseudogenes can be recombined into the functional expression site to generate new antigenic variants. Coordinated control of the recombination of these genes would allow these two gene families to act synergistically to evade the host immune response.


Figures

Figure 1
Figure 1
(A) Presence of a single genomic expression site for msp2. (Left) A blot hybridized with a msp2 5′ end-specific probe corresponding to bp 2-335. (Right) The same blot hybridized with an orf2-specific probe corresponding to bp 6-359. Lambda HindIII markers are shown. (B) Schematic representation of the msp2 operon. The hypervariable region of msp2 is stippled. Positions of KpnI sites are shown (K). The KpnI site in the hypervariable region is polymorphic. Arrows indicate the positions of primers used to amplify DNA and cDNA clones.
Figure 2
Figure 2
Schematic representation of genomic pseudogenes. BAC 2439 is 45 kb in length. Msp3-11 is 3263 bp in length. It is shown to the same scale as BAC 2439 for comparison and is enlarged to show the positions of primers F1, F2, R1, and R2 used for amplification and cloning of pseudogenes. The sequence of the primers is as follows: F1: GCACCAAAGAATATAGCTGTAAATAC; F2: CCCAGCTTCTGCACAAAC; R1: TGTTGCCCGCCATCC; R2: CTCTAGCACCTTCAGCATC. The complete pseudogene complex is illustrated. Msp2 pseudogenes are striped and msp3 pseudogenes are dark gray. The orientation of pseudogenes is indicated by the direction of the arrow. Ovals indicate the presence of the conserved 600-bp sequence.
Figure 3
Figure 3
Pseudogene amplicons generated with primers F1, F2, R1, and R2. Amplicons were generated with the use of A. marginale South Idaho DNA from calf 824. The amplicon in Lane A was generated with primers F1 and R1, Lane B used primers F2 and R1, Lane C used primers F1 and R2, and Lane D used primers F2 and R2. Lane M contains the molecular weight standards λHindIII and φχHaeIII.
Figure 4
Figure 4
(A) Schematic representation of full-length msp2 compared with the msp2 pseudogenes. Numbering of full-length msp2 is indicated in base pairs and amino acids. The hypervariable region is indicated by stippling. (B) The deduced amino acid sequences of the msp2 pseudogenes obtained in this study are shown in comparison to the full-length msp2 sequence. The 5′ and 3′ conserved regions are on a gray background and flank the hypervariable region. The full-length pCKR11.2 continues for 134 aa (not shown). Pseudogenes 1 and 2 are from an A. marginale St. Maries strain, pseudogene 3 is from an A. marginale Florida strain (8), and the remaining pseudogenes are from an A. marginale South Idaho strain and are lettered A-D as denoted in Fig. 3.
Figure 5
Figure 5
Alignment of the deduced amino acid sequences of known msp3 (pseudo)genes in comparison with msp2. The gray region highlights a region of sequence similarity between msp2 and msp3. The black background indicates regions of sequence conservation in msp3 flanking the hypervariable region. The hypervariable region of msp3 from alignment position 301–909 is not shown.

References

    1. Zhang J-R, Hardham J M, Barbour A G, Norris S J. Cell. 1997;89:275–285. - PubMed
    1. Barbour A G. Trends Microbiol. 1993;1:236–239. - PubMed
    1. Yu X-J, McBride J W, Zhang X-F, Walker D H. Gene. 2000;248:59–68. - PubMed
    1. Reddy G R, Streck C P. Mol Cell Biol Res Commun. 1999;1:167–175. - PubMed
    1. Ohashi N, Unver A, Zhi N, Rikihisa Y. J Clin Microbiol. 1998;36:2671–2680. - PMC - PubMed

Publication types

Substances

LinkOut - more resources