. 2001 Mar 27;98(7):4172-7.
doi: 10.1073/pnas.061013698. Epub 2001 Feb 27.

Differences in quantal amplitude reflect GluR4- subunit number at corticothalamic synapses on two populations of thalamic neurons

Affiliations

Differences in quantal amplitude reflect GluR4- subunit number at corticothalamic synapses on two populations of thalamic neurons

P Golshani et al. Proc Natl Acad Sci U S A. .

Abstract

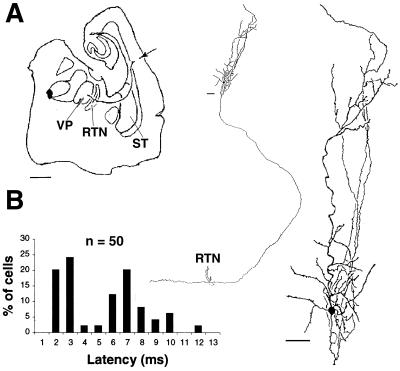
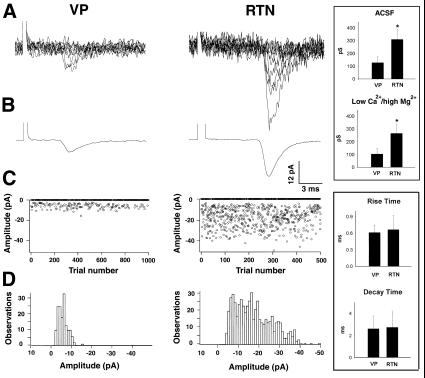
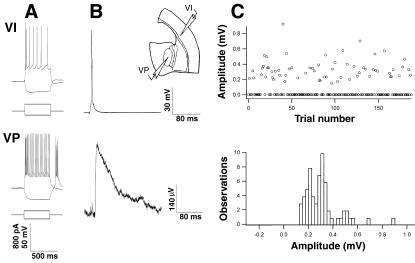
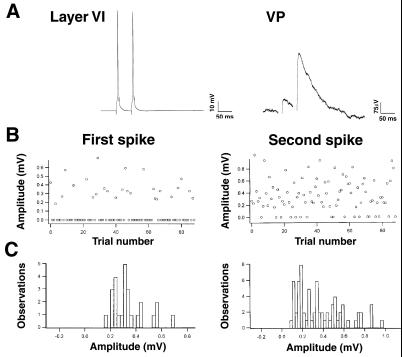
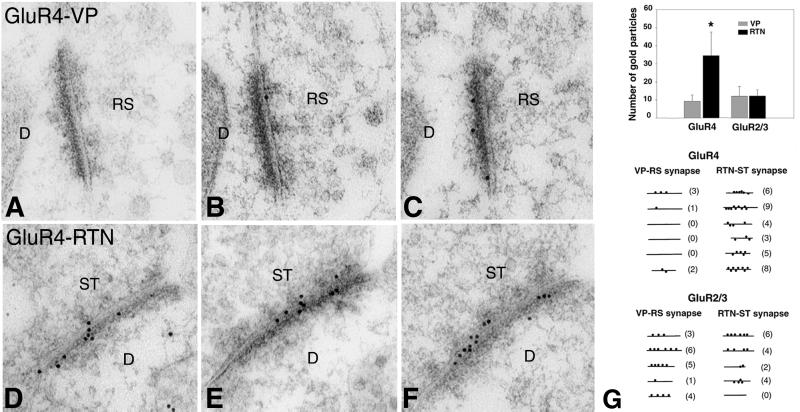
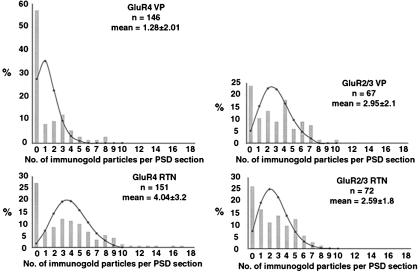
Low-frequency thalamocortical oscillations that underlie drowsiness and slow-wave sleep depend on rhythmic inhibition of relay cells by neurons in the reticular nucleus (RTN) under the influence of corticothalamic fibers that branch to innervate RTN neurons and relay neurons. To generate oscillations, input to RTN predictably should be stronger so disynaptic inhibition of relay cells overcomes direct corticothalamic excitation. Amplitudes of excitatory postsynaptic conductances (EPSCs) evoked in RTN neurons by minimal stimulation of corticothalamic fibers were 2.4 times larger than in relay neurons, and quantal size of RTN EPSCs was 2.6 times greater. GluR4-receptor subunits labeled at corticothalamic synapses on RTN neurons outnumbered those on relay cells by 3.7 times, providing a basis for differences in synaptic strength.


Figures

Figure 1
Figure 1
(A) Thalamocortical slice preparation and an injected layer VI corticothalamic neuron with its axon giving off collaterals in RTN and continuing into VP. (Bars = 50 μm). (B) Latencies of synaptic responses in RTN neurons following stimulation of layer VI. The early peak represents responses to antidromic activation of thalamocortical collaterals, and the later peak represents responses to orthodromic activation of slower conducting corticothalamic fibers.
Figure 2
Figure 2
(A) Overlay of 10 voltage-clamp traces from a VP neuron (Left) and an RTN neuron (Right), following minimal stimulation of corticothalamic fibers, showing EPSC successes and failures. Minimal EPSC amplitudes are larger in RTN neurons than in VP neurons. (B Left) Average of EPSC successes recorded from the VP neuron, averaged from responses to 500 stimuli. (B Right) Average of EPSC successes recorded from the RTN neuron in A, averaged from responses to 1,000 stimuli. The average EPSC in VP and RTN neurons exhibits fast rise and decay times. (C) Graph illustrating the trial-to-trial variability in EPSC peak amplitudes recorded in the VP (Left) and RTN (Right) neurons showing the large number of failures and small size of EPSCs. (D) Distribution of EPSC amplitudes recorded in the VP (Left) and RTN (Right) neurons showing comparatively narrow amplitude distribution of EPSC successes in the VP neuron and range of amplitudes of EPSC successes in the RTN neuron. (Upper Inset) Mean conductance of EPSC successes in VP and RTN cells recorded in artificial cerebrospinal fluid and low-Ca2+/high-Mg2+ solutions. Asterisks indicate a statistically significant difference. (Lower Inset) Rise and decay times of EPSC successes in VP and RTN neurons. Slight differences are not significant statistically.
Figure 3
Figure 3
(A) Intrinsic firing patterns of a regular-spiking layer VI neuron (Upper) and a synaptically coupled VP neuron (Lower) revealed by injection of current. (B Upper) Averaged trace of single action potentials induced by injection of current into the layer VI neuron. (B Lower) Average of unitary EPSP successes recorded in the VP neuron and induced by single action potentials in the synaptically coupled layer VI neuron. (The neurons were coupled in the corticothalamic direction only). (C Upper) Trial-to-trial variability in unitary EPSP amplitude showing large number of trials in which presynaptic action potential did not induce an EPSP. (C Lower) Distribution of unitary EPSP amplitudes (excluding failures).
Figure 4
Figure 4
(A Left) Averaged trace of pairs of action potentials separated by 50 msec and induced in a layer VI neuron. (A Right) Averaged trace of pairs of EPSPs recorded in a synaptically coupled VP neuron induced by the pairs of action potentials, showing paired-pulse facilitation. Capacitative-coupling artifacts have been blanked. (B) Trial-to-trial variability in EPSP amplitude following the first (Right) and second (Left) action potentials illustrated in A. (C) Distribution of unitary EPSP amplitudes after first (Right) and second (Left) action potentials showing large decrease in failures following second action potential.
Figure 5
Figure 5
(A, B, and C) Serial electron micrographs from a single corticothalamic synapse in VP showing small number of GluR4 immunogold-labeled particles at the PSD. (D, E, and F) Serial electron micrographs from a single corticothalamic synapse in RTN showing larger number of GluR4 immunogold particles at the PSD. (Bar = 125 nM.) (G Upper) Mean number of GluR4 subunit-specific particles at serially sectioned corticothalamic synapses in RTN is much higher than at synapses in VP (* P < 0.0001). Mean number of GluR2/3 particles is approximately equal. (G Lower) Tracings of the PSDs and associated immunogold particles from two serially sectioned corticothalamic synapses in VP and two in RTN. Number of particles associated with each section through the PSD is in parentheses. GluR4 particles are associated with all sections through the PSD of the RTN synapse, but some sections through the PSD of the VP synapse typically lack GluR4 particles. GluR2/3 particles have identical distributions in VP and RTN.
Figure 6
Figure 6
Counts of GluR4 and GluR2/3 particles at randomly sectioned PSDs in RTN and VP. Overlying curves show theoretical Poisson-distributed data with means corresponding to the observed means. Similarity in observed and theoretical distributions implies that quantification of receptor-subunit numbers was based on random exposure of epitopes to the immunoreagents.

Comment in

References

    1. Bourassa J, Pinault D, Deschênes M. Eur J Neurosci. 1995;7:19–30. - PubMed
    1. Hoogland P V, Welker E, Van Der Loos H. Exp Brain Res. 1987;68:73–87. - PubMed
    1. Steriade M. Adv Neurol. 1998;77:105–134. - PubMed
    1. Deschênes M, Hu B. Eur J Neurosci. 1990;2:140–152. - PubMed
    1. McCormick D A, Von Krosigk M. Proc Natl Acad Sci USA. 1992;89:2774–2778. - PMC - PubMed

Publication types

Substances

LinkOut - more resources