. 2001 Mar 27;98(7):4221-6.
doi: 10.1073/pnas.071516798.

Pendrin, encoded by the Pendred syndrome gene, resides in the apical region of renal intercalated cells and mediates bicarbonate secretion

Affiliations

Pendrin, encoded by the Pendred syndrome gene, resides in the apical region of renal intercalated cells and mediates bicarbonate secretion

I E Royaux et al. Proc Natl Acad Sci U S A. .

Abstract

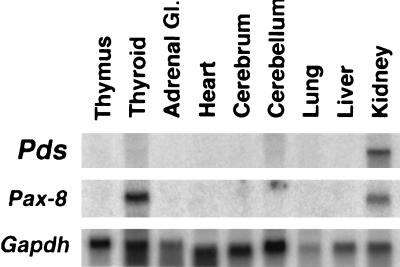
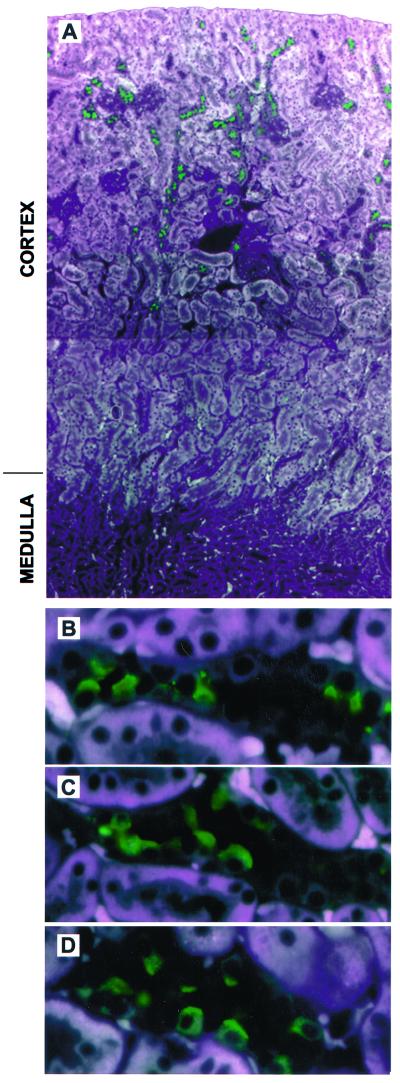
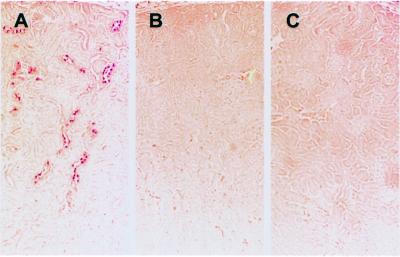
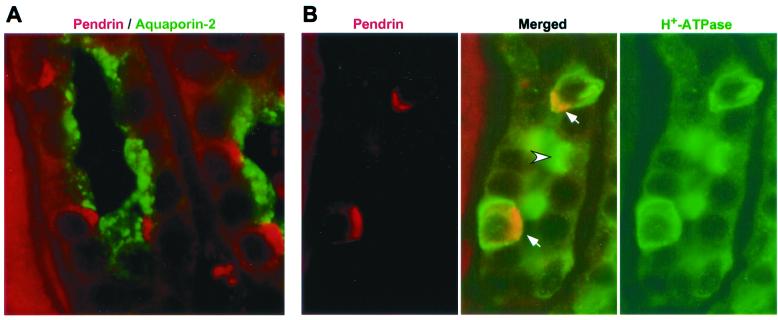
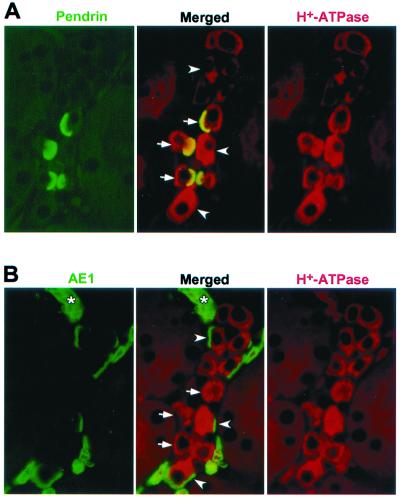
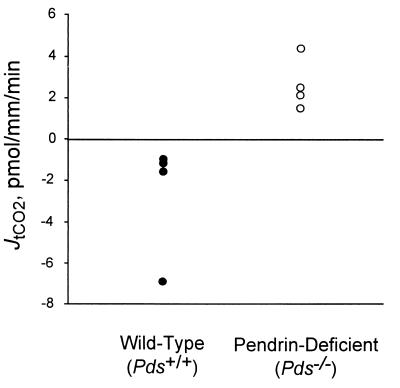
Pendrin is an anion transporter encoded by the PDS/Pds gene. In humans, mutations in PDS cause the genetic disorder Pendred syndrome, which is associated with deafness and goiter. Previous studies have shown that this gene has a relatively restricted pattern of expression, with PDS/Pds mRNA detected only in the thyroid, inner ear, and kidney. The present study examined the distribution and function of pendrin in the mammalian kidney. Immunolocalization studies were performed using anti-pendrin polyclonal and monoclonal antibodies. Labeling was detected on the apical surface of a subpopulation of cells within the cortical collecting ducts (CCDs) that also express the H(+)-ATPase but not aquaporin-2, indicating that pendrin is present in intercalated cells of the CCD. Furthermore, pendrin was detected exclusively within the subpopulation of intercalated cells that express the H(+)-ATPase but not the anion exchanger 1 (AE1) and that are thought to mediate bicarbonate secretion. The same distribution of pendrin was observed in mouse, rat, and human kidney. However, pendrin was not detected in kidneys from a Pds-knockout mouse. Perfused CCD tubules isolated from alkali-loaded wild-type mice secreted bicarbonate, whereas tubules from alkali-loaded Pds-knockout mice failed to secrete bicarbonate. Together, these studies indicate that pendrin is an apical anion transporter in intercalated cells of CCDs and has an essential role in renal bicarbonate secretion.


Figures

Figure 1
Figure 1
Northern blot analysis of Pds mRNA in various rat tissues. A Northern blot containing 10 μg of total RNA per lane from the indicated rat tissues was prepared and hybridized with a Pds-, Pax-8-, or Gapdh-specific probe, as indicated. The Pds-specific probe hybridized only to the ≈5-kb mRNA shown. The Pax-8-specific probe was used as a positive control for the thyroid and kidney mRNA.
Figure 2
Figure 2
Immunofluorescent staining of pendrin in mouse and rat kidney. Paraformaldehyde-fixed, paraffin-embedded kidney sections were incubated with rabbit anti-pendrin antibodies followed by fluorescein-labeled anti- rabbit secondary antibody (1:250). (A) A low-power composite view (original magnification ×100) of mouse kidney showing cortical cells staining with an anti-pendrin antibody (h766–780; 1:1000). Strong pendrin-specific staining (in green) is seen in the cortex; no staining is detected in the outer or inner medulla. (B) A higher-power view (original magnification ×630) of the section shown in A illustrating the apical staining of pendrin-positive cells. Note that pendrin is only detected in a subset of cells within a given tubule. Similar studies were performed with rat kidney stained with the same antibody as A and B (C) or with a published (7) anti-pendrin antibody (D; r612–625; 1:1000), revealing an identical pattern of apical staining in the cortex. All photomicrographs represent merged images captured with three distinct excitation lights (345, 490, and 540 nm); this approach allows the cellular structure to be visualized in conjunction with the FITC-associated staining (in green). Note that the white areas in A reflect fluorescence of the proximal tubules; the same background is also seen in the presence of immunizing peptide as well as in kidney sections derived from Pds-knockout mice.
Figure 3
Figure 3
Immunohistochemical staining of pendrin in mouse kidney. Paraformaldehyde-fixed, paraffin-embedded kidney sections from wild-type (Pds+/+; A and B) or pendrin-deficient (Pds−/−; C) mice were incubated with a rabbit anti-pendrin antibody (h766–780; 1:2000). In B, the antibody was preincubated with the pendrin-specific h766–780 peptide. (Original magnification ×100.)
Figure 4
Figure 4
Localization of pendrin relative to other proteins in human kidney. Paraformaldehyde-fixed, paraffin-embedded human kidney sections were double-labeled with a polyclonal antibody to aquaporin-2 (green; 1:1000) and a monoclonal antibody to pendrin (red; 1:50), with the staining seen in the CCDs shown in A. In B, similar sections were stained with a polyclonal antibody to H+-ATPase (green; 1:1000) and the anti-pendrin monoclonal antibody (red; 1:50). In the merged image, note the α-intercalated cell with apical staining for H+-ATPase (arrowhead) and the two other intercalated cells staining for both H+-ATPase and pendrin (arrows), with the resulting yellow areas corresponding to the pendrin-containing apical regions. Also note the other cells in the same tubule that are negative for both proteins; these are the principal cells. (Original magnification ×1000.)
Figure 5
Figure 5
Localization of pendrin relative to other proteins in mouse kidney. Paraformaldehyde-fixed, paraffin-embedded mouse kidney sections were double-labeled with the monoclonal antibody E11 to H+-ATPase (red; undiluted) and either the anti-pendrin polyclonal antibody h766–780 (green; 1:1000) or an anti-AE1 antibody (green, 1:500). The micrographs shown in A and B reflect identical areas of two serial sections (2 μm each). When comparing the merged images in A and B, note the different subpopulations of cells staining for pendrin (arrows) and AE1 (arrowheads). Also note that some intercalated cells are negative for both pendrin and AE1. The asterisk indicates red blood cells staining only for AE1. (Original magnification ×1000).
Figure 6
Figure 6
Influence of pendrin on JtCO2. Isolated CCD tubules from wild-type (Pds+/+) or pendrin-deficient (Pds−/−) mice were perfused in symmetric, HCOformula image/CO2-buffered solutions. tCO2 concentration was measured in collected perfusate samples in CCD tubules. Values measured for each tubules are given (see Table 1 for additional details). In wild-type mice, the JtCO2 was −2.6 ± 1.4 pmol/mm/min (n = 4); in pendrin-deficient mice, the JtCO2 was +2.7 ± 0.6 pmol/mm/min (n = 4, P < 0.05).

References

    1. Everett L A, Glaser B, Beck J C, Idol J R, Buchs A, Heyman M, Adawi F, Hazani E, Nassir E, Baxevanis A D, et al. Nat Genet. 1997;17:411–422. - PubMed
    1. Van Hauwe P, Everett L A, Coucke P, Scott D A, Kraft M L, Ris-Stalpers C, Bolder C, Otten B, de Vijlder J J, Dietrich N L, et al. Hum Mol Genet. 1998;7:1099–1104. - PubMed
    1. Coyle B, Reardon W, Herbrick J A, Tsui L C, Gausden E, Lee J, Coffey R, Grueters A, Grossman A, Phelps P D, et al. Hum Mol Genet. 1998;7:1105–1112. - PubMed
    1. Everett L A, Morsli H, Wu D K, Green E D. Proc Natl Acad Sci USA. 1999;96:9727–9732. - PMC - PubMed
    1. Scott D A, Wang R, Kreman T M, Sheffield V C, Karniski L P. Nat Genet. 1999;21:440–443. - PubMed

Publication types

Associated data