. 2001 Apr;67(4):1636-45.
doi: 10.1128/AEM.67.4.1636-1645.2001.

Determination of DNA content of aquatic bacteria by flow cytometry

Affiliations

Determination of DNA content of aquatic bacteria by flow cytometry

D K Button et al. Appl Environ Microbiol. 2001 Apr.

Abstract

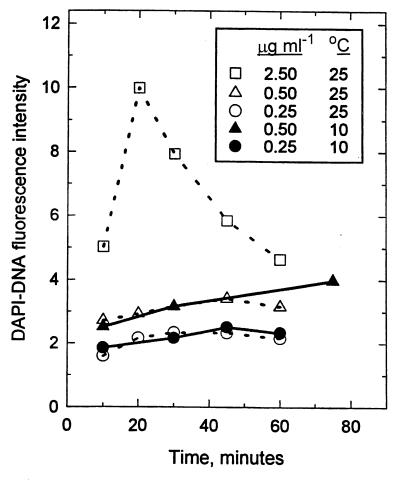
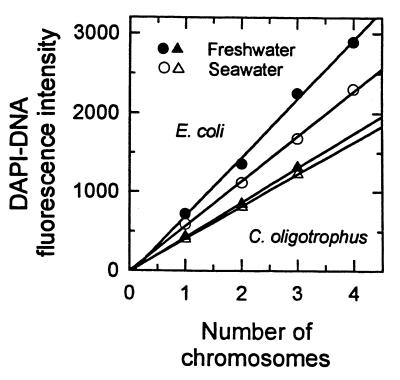
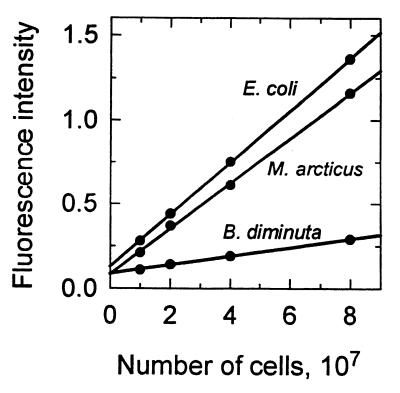
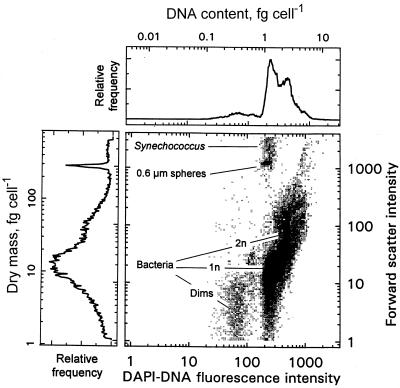
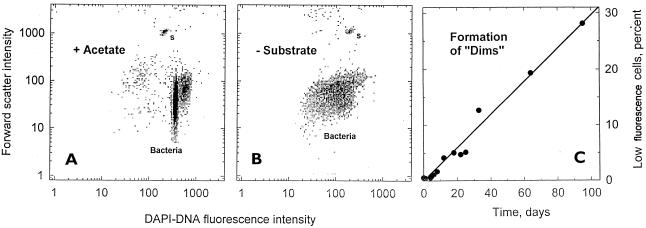
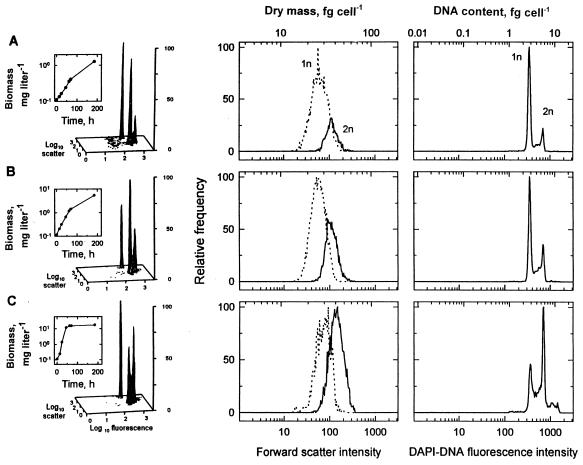
The distribution of DNA among bacterioplankton and bacterial isolates was determined by flow cytometry of DAPI (4',6'-diamidino-2-phenylindole)-stained organisms. Conditions were optimized to minimize error from nonspecific staining, AT bias, DNA packing, changes in ionic strength, and differences in cell permeability. The sensitivity was sufficient to characterize the small 1- to 2-Mb-genome organisms in freshwater and seawater, as well as low-DNA cells ("dims"). The dims could be formed from laboratory cultivars; their apparent DNA content was 0.1 Mb and similar to that of many particles in seawater. Preservation with formaldehyde stabilized samples until analysis. Further permeabilization with Triton X-100 facilitated the penetration of stain into stain-resistant lithotrophs. The amount of DNA per cell determined by flow cytometry agreed with mean values obtained from spectrophotometric analyses of cultures. Correction for the DNA AT bias of the stain was made for bacterial isolates with known G+C contents. The number of chromosome copies per cell was determined with pure cultures, which allowed growth rate analyses based on cell cycle theory. The chromosome ratio was empirically related to the rate of growth, and the rate of growth was related to nutrient concentration through specific affinity theory to obtain a probe for nutrient kinetics. The chromosome size of a Marinobacter arcticus isolate was determined to be 3.0 Mb by this method. In a typical seawater sample the distribution of bacterial DNA revealed two major populations based on DNA content that were not necessarily similar to populations determined by using other stains or protocols. A mean value of 2.5 fg of DNA cell(-1) was obtained for a typical seawater sample, and 90% of the population contained more than 1.1 fg of DNA cell(-1).


Figures

FIG. 1
FIG. 1
Effect of DAPI concentration on DNA fluorescence intensity (I). The values are means for the first (1n) and second (2n) fluorescence peaks from M. arcticus, such as those shown for C. oligotrophus in Fig. 4A. (Inset) Scatchard transformation for the 2n cells.
FIG. 2
FIG. 2
Effect of staining time and temperature on fluorescence of M. arcticus at different DAPI concentrations.
FIG. 3
FIG. 3
Effect of chromosome number (n) on DAPI-DNA fluorescence intensity in both fresh and saline media. For E. coli n = 1 to 4, y = 741.1x − 48.9 (r2 = 0.995), and y = 569.5x − 3.3 (r2 = 0.998). For C. oligotrophus, n = 1 to 3, y = 439x − 14.9 (r2 = 0.998), and y = 409.1x − 5.4 (r2 = 0.999).
FIG. 4
FIG. 4
DNA content of C. oligotrophus. (A) DNA histogram for a stationary-phase culture with chromosome runout. The coefficients of variation for the one- to five-chromosome peaks ranged from 4.28 to 8.73%. (B) Linearity between DNA content determined from the standard curve and modal values for the fluorescence intensity from panel A. (C) Relationships between DNA content and dry mass and between DNA content and DNA concentration. Values were calculated by using a genome size of 3.5 fg cell−1 and a dry weight/wet weight ratio of 0.2; dry mass was determined by using forward light scatter intensity data (49).
FIG. 5
FIG. 5
Fluorescence intensity as determined with a spectrophotometer of Hoechst 33258-stained DNA extracted from various dilutions of cultures of three species of bacteria.
FIG. 6
FIG. 6
Comparison of apparent DNA contents of DAPI-stained cells of various species determined by flow cytometry with values determined by spectrophotometric analysis of Hoechst-stained extracts of populations measured by flow cytometry (y = 1.04x + 0.12; r2 = 0.899).
FIG. 7
FIG. 7
Dot plot of euphotic zone marine bacterioplankton collected from Thumb Cove in Resurrection Bay off the Gulf of Alaska. The locations of dims, a cluster at the likely position of Synechococcus, and 1n cells and a possible location of 2n cells are indicated.
FIG. 8
FIG. 8
Formation of low-fluorescence dims from C. oligotrophus cells. (A) Histogram of light scatter (cell mass) versus DAPI-DNA fluorescence for a normal population. s, 0.6-μm beads. (B) Population formed after substrate removal. The computed amount of DNA decreased from 2.1 and 4.2 fg cell−1 for the 1n and 2n clusters to 0.2 to 0.6 fg cell−1. (C) Rate of dim formation.
FIG. 9
FIG. 9
Growth curves and dry mass-DNA histograms for C. oligotrophus. The histograms show the results obtained after 24 h of growth. The distributions of light scatter and fluorescence intensities associated with the cells at three growth rates are given (lower scales), and these values were converted to dry weights and DNA contents (upper scales) for the main subpopulations.
FIG. 10
FIG. 10
Effect of acetate concentration on the growth rate (●) and the chromosome ratio of C. oligotrophus determined from the 2n and 1n chromosome peak heights (Fig. 9) after 17 h (▵) and 24 h (▿) in batch culture.

References

    1. Albert F G, Eckdahl T T, Fitzgerald D J, Anderson J N. Heterogeneity in the actions of drugs that bind in the DNA minor groove. Biochemistry. 1999;38:10135–10146. - PubMed
    1. Barcellona M L, Favilla R, VonBerger J, Avitabile M, Ragusa N, Masotti L. DNA–4′-6-diamidino-2-phenylindole interactions: a comparative study employing fluorescence and ultraviolet spectroscopy. Arch Biochem Biophys. 1986;250:48–53. - PubMed
    1. Binder B J, Chisholm S W. Cell cycle regulation in marine Synechococcus sp. strains. Appl Environ Microbiol. 1995;61:708–717. - PMC - PubMed
    1. Binder B J, Liu Y C. Growth rate regulation of rRNA content of a marine Synechococcus (cyanobacterium) strain. Appl Environ Microbiol. 1998;64:3346–3351. - PMC - PubMed
    1. Button D K. Nutrient uptake by microorganisms according to kinetic parameters from theory as related to cytoarchitecture. Microbiol Mol Biol Rev. 1998;62:636–645. - PMC - PubMed

Publication types

LinkOut - more resources