Comparative Study
. 2001 Apr;11(4):566-84.
doi: 10.1101/gr.149301.

A comparative genomics approach to prediction of new members of regulons

Affiliations
Comparative Study

A comparative genomics approach to prediction of new members of regulons

K Tan et al. Genome Res. 2001 Apr.

Abstract

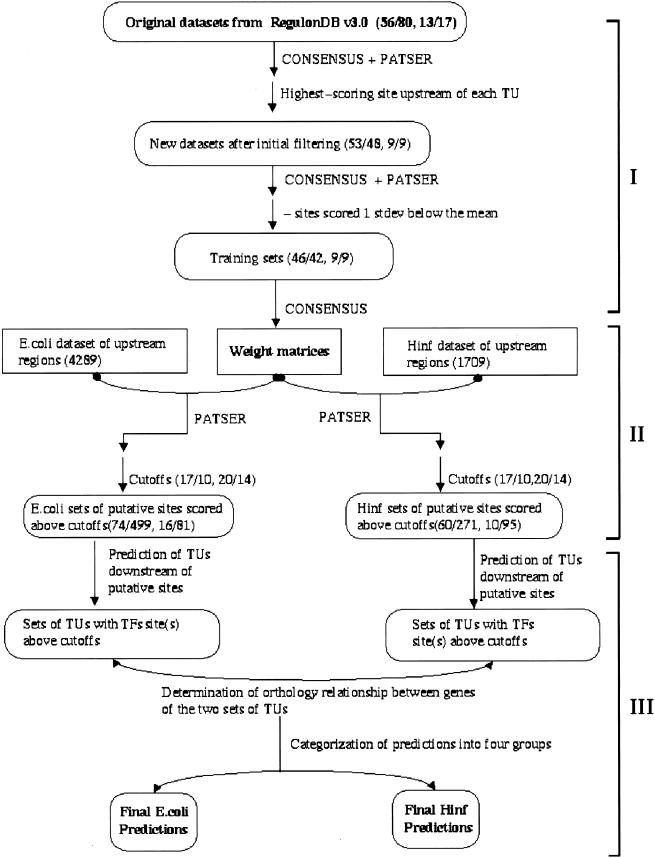
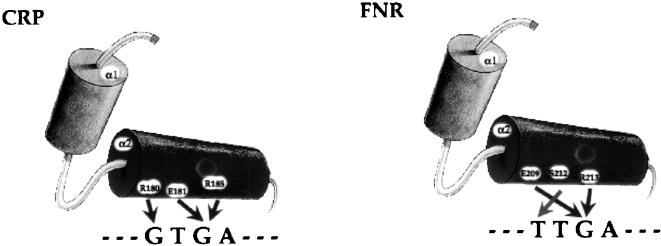
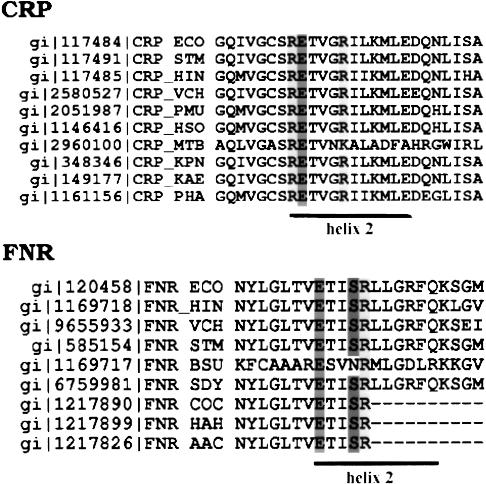
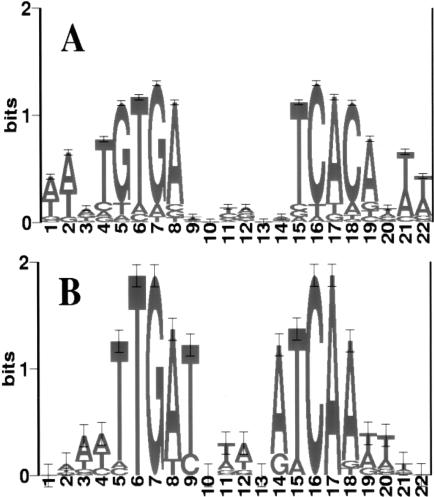
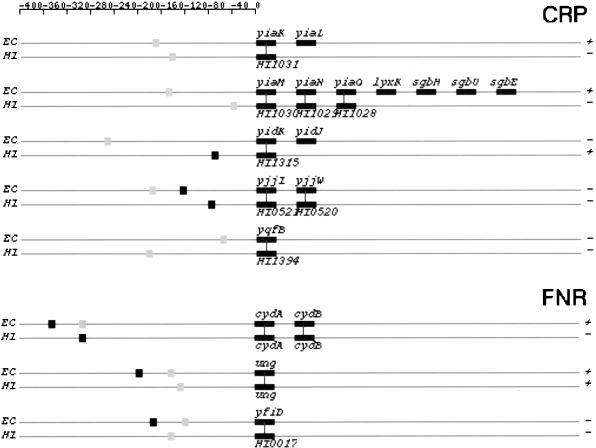
Identifying the complete transcriptional regulatory network for an organism is a major challenge. For each regulatory protein, we want to know all the genes it regulates, that is, its regulon. Examples of known binding sites can be used to estimate the binding specificity of the protein and to predict other binding sites. However, binding site predictions can be unreliable because determining the true specificity of the protein is difficult because of the considerable variability of binding sites. Because regulatory systems tend to be conserved through evolution, we can use comparisons between species to increase the reliability of binding site predictions. In this article, an approach is presented to evaluate the computational predictions of regulatory sites. We combine the prediction of transcription units having orthologous genes with the prediction of transcription factor binding sites based on probabilistic models. We augment the sets of genes in Escherichia coli that are expected to be regulated by two transcription factors, the cAMP receptor protein and the fumarate and nitrate reduction regulatory protein, through a comparison with the Haemophilus influenzae genome. At the same time, we learned more about the regulatory networks of H. influenzae, a species with much less experimental knowledge than E. coli. By studying orthologous genes subject to regulation by the same transcription factor, we also gained understanding of the evolution of the entire regulatory systems.


Figures

Figure 1
Figure 1
Flowchart depicting our overall strategy for predicting additional members of CRP and FNR regulons. The approach is divided into three stages. In the first stage (I), raw data sets from RegulonDB are filtered for strong binding sites, and weight matrices based on these strong sites are generated. Two pairs of numbers are shown in this part of the chart; the first pair is CRP data and the second pair FNR data. Within each number pair, the first number is the number of TUs regulated by a particular transcription factor, and the second number is the number of transcription factor binding sites. In the second stage (II), regulatory region (−400 to +50 bp) of each ORF in both genomes (4289 in E. coli and 1709 in H. influenzae) are searched by PATSER for potential transcription factor binding sites. Cutoff scores for strong (17 for CRP and 20 for FNR) and weak (10 for CRP and 14 for FNR) binding sites are chosen. Only predicted sites scored above weak site cutoffs are used for further analyses. Numbers of predicted CRP- and FNR-binding sites scored above cutoffs are shown for both genomes. The first pair of numbers represent CRP sites and the second FNR sites. In stage three (III), transcription units after predicted binding sites are predicted, and the orthology relationship between genes in E. coli and H. influenzae transcription units are determined. Finally, site scores and orthology information are used together to categorize our predictions. TU, transcription unit; TF, transcription factor.
Figure 2
Figure 2
Schematic representation of the specificity-conferring interactions between the recognition helices (helix 2) of E. coli CRP and FNR proteins and their consensus half-site binding motifs. CRP, cAMP receptor protein; FNR, fumarate and nitrate reduction regulatory protein.
Figure 3
Figure 3
Multiple sequence alignment of CRP and FNR proteins from various bacterial genomes. Only sequences around the second helix of the helix–turn–helix motif are shown. The boundaries of the second helix are labelled with a solid line. The highly conserved RE—R motif in CRP protein and E–SR motif in FNR protein are shaded. FNR_AAC, FNR_COC, and FNR_HAH are partial sequences derived from homology cloning (Hattori et al. 1996). (AAC) Actinobacillus actinomycetemcomitans; (BSU) Bacillus subtilis; (COC) Capnocytophaga ochracea; (ECO) Escherichia coli; (HAH) Haemophilus aphrophilus; (HIN) Haemophilus influenzae; (HSO) Haemophilus somnus; (KAE) Klebsiella aerogenes; (KPN) Klebsiella pneumoniae; (MTB) Mycobacterium tuberculosis; (PHA) Pasteurella haemophilus serotype 1; (PMU) Pasteurella multocida; (SDY) Shigella dysenteriae; (STM) Salmonella typhimurium; (VCH) Vibrio cholerae. CRP, cAMP receptor protein; FNR, fumarate and nitrate reduction regulatory protein.
Figure 4
Figure 4
Sequence logos for the CRP- and FNR-binding motifs. It was generated based on the multiple sequence alignments by CONSENSUS by using the training sequences. (horizontal axis) Position in the binding motif; (vertical axis) information content in bits. The height of each letter is proportional to its prevalence at the given position.
Figure 5
Figure 5
Fraction of sites located either upstream of or within TUs in E. coli. All sites in E. coli genome above certain cutoff are divided into two groups according to their locations relative to TUs: upstream of or within. (a) CRP sites; (b) FNR sites. TU, transcription unit.
Figure 6
Figure 6
Training set TUs regulated by CRP and FNR and H. influenzae TUs containing orthologs to genes in the training set. Genes in a TU are represented by rectangular boxes. Binding sites are represented by square boxes with gray box representing a weak site and black box representing a strong site. The distance between a binding site and the translation start is proportional to the real distance on the genomic sequence. Gene boxes and distances between genes are not in proportion. Orthology relationship is indicated by a solid line between the two genes involved. (+ and −) The strandness of a transcription unit. EC, E. coli; HI, H. influenzae; CRP, cAMP receptor protein; FNR, fumarate and nitrate reduction regulatory protein.
Figure 7
Figure 7
Orthologous TU pairs from categories I and IIA that are predicted to be regulated by CRP and FNR. CRP-regulated TUs are shown first followed by FNR-regulated TUs. Symbols and drawing schemes are as described for Figure 6. CRP, cAMP receptor protein; FNR, fumarate and nitrate reduction regulatory protein.
Figure 7
Figure 7
Orthologous TU pairs from categories I and IIA that are predicted to be regulated by CRP and FNR. CRP-regulated TUs are shown first followed by FNR-regulated TUs. Symbols and drawing schemes are as described for Figure 6. CRP, cAMP receptor protein; FNR, fumarate and nitrate reduction regulatory protein.

References

    1. Altschul SF, Madden TL, Schaffer AA, Zhang J, Zhang Z, Miller W, Lipman DJ. Gapped BLAST and PSI-BLAST: A new generation of protein database search programs. Nucleic Acids Res. 1997;25:3389–3402. - PMC - PubMed
    1. Benson DA, Boguski MS, Lipman DJ, Ostell J, Francis Ouellette BF, Rapp BA, Wheeler DL. GenBank. Nucleic Acids Res. 1999;27:12–17. - PMC - PubMed
    1. Blattner FR, Plunkett G, III, Bloch CA, Perna NT, Burland V, Riley M, Collado-Vides J, Glasner JD, Rode CK, Mayhew GF, et al. The complete genome sequence of Escherichia coli K-12. Science. 1997;277:1453–1474. - PubMed
    1. Craven M, Page D, Shavlik J, Bockhorst J, Glasner J. A probabilistic learning approach to whole-genome operon prediction. Proc Int Conf Intell Syst Mol Biol. 2000;8:116–127. .. - PubMed
    1. Dandekar T, Snel B, Huynen M, Bork P. Conservation of gene order: A fingerprint of proteins that physically interact. Trends Biochem Sci. 1998;23:324–328. - PubMed

Publication types

MeSH terms

LinkOut - more resources