. 2001 Apr 1;532(Pt 1):17-30.
doi: 10.1111/j.1469-7793.2001.0017g.x.

Two gamma2L subunit domains confer low Zn2+ sensitivity to ternary GABA(A) receptors

Affiliations

Two gamma2L subunit domains confer low Zn2+ sensitivity to ternary GABA(A) receptors

N Nagaya et al. J Physiol. .

Abstract

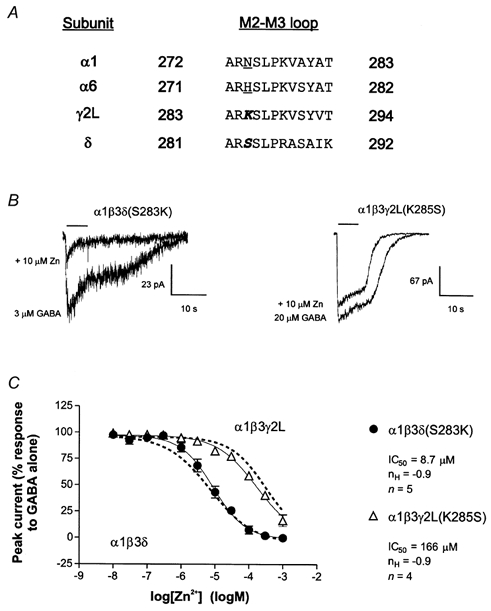
The sensitivity of GABAA receptors (GABARs) to Zn2+ inhibition depends on subunit composition. The predominant neuronal forms of mammalian GABARs, alpha(beta)gamma and, alpha(beta)delta are differentially sensitive to Zn2+ inhibition; alpha(beta)gamma receptors are substantially less sensitive than alpha(beta)delta receptors. Recently, functional domains involved in Zn2+ sensitivity have been identified in and subunits. Our aim in the present study was to localize functional domains of low Zn2+ sensitivity within gamma2L subunits. Chimeric subunits were constructed by progressively replacing the rat gamma2L subunit sequence with that of the rat delta subunit sequence. Whole-cell currents were recorded from mouse L929 fibroblasts coexpressing wild-type rat alpha1 and beta3 subunits with a chimeric delta-gamma2L subunit. Unlike alpha and beta subunits, the gamma2L subunit was found to contain a determinant of low Zn2+ sensitivity in the N-terminal extracellular region. In addition, we identified determinants in the M2 segment and the M2-M3 loop of the gamma2L subunit that are homologous to those found in beta and alpha subunits. We postulate that the interface between the latter two domains, which may form the outer vestibule of the channel, represents a single functional domain modulating Zn2+ sensitivity. Thus, the Zn2+ sensitivity of ternary GABARs appears to be determined by two functional domains, one in the N-terminal extracellular region and one near the outer mouth of the channel.


Figures

Figure 1
Figure 1. Schematic representation of four δ-γ2L chimeric subunits
The putative membrane topologies for four δ-γ2L chimeras are shown. Above each subunit, the chimera name is given, and below each subunit, the splice sites are given by amino acid and residue number. For each subunit, the extracellular N- and C-termini are indicated (N, C) and the four putative transmembrane segments labelled (M1-M4). The extent of rat δ subunit sequence is represented by dashed lines whereas the extent of rat γ2L subunit sequence is represented by continuous lines.
Figure 2
Figure 2. GABA sensitivity of GABARs containing chimeric δ-γ2L subunits
A, representative whole-cell currents from L929 fibroblasts expressing α1β3δ-γ2L(M1e) receptors (upper left), α1β3δ-γ2L(M1i) receptors (upper right), α1β3δ-γ2L(M2e) receptors (lower left), or α1β3δ-γ2L(M3e) receptors (lower right). The indicated concentrations of GABA were applied for 6-12 s (horizontal bars) to cells voltage clamped at -75 mV. B, concentration-response curves for cells expressing α1β3δ-γ2L(M1e) receptors (Δ), α1β3δ-γ2L(M1i) receptors (○), α1β3δ-γ2L(M2e) receptors (▴) and α1β3δ-γ2L(M3e) receptors (•) are shown by continuous lines. Concentration-response curves for wild-type α1β3δ (left) and α1β3γ2L (right) receptors are shown for comparison (dashed lines). The peak response to each concentration of GABA was normalized as a percentage of the maximum current response for each cell. Values are means ±s.e.m. Data for each isoform were fitted with a four-parameter logistic equation with the indicated EC50 values and Hill slopes (nH).
Figure 3
Figure 3. Zn2+ sensitivity of GABARs containing wild-type δ or γ2L subunits
A, representative whole-cell currents from L929 fibroblasts expressing α1β3δ receptors (left) or α1β3γ2L receptors (right). GABA or GABA plus 10 μm Zn2+ was applied for 7 s (horizontal bars) to cells voltage clamped at -75 mV. The concentration of GABA used was near the EC50 value for the given isoform. B, concentration-response curves for cells expressing α1β3δ receptors (•) or α1β3γ2L receptors (Δ). The peak response to each concentration of Zn2+ was normalized as a percentage of the maximum current response to GABA alone for each cell. Values are means ±s.e.m. Data for each isoform were fitted with a four-parameter logistic equation with the indicated IC50 values and Hill slopes (nH).
Figure 4
Figure 4. Zn2+ sensitivity of GABARs containing chimeric δ-γ2L subunits
A, representative whole-cell currents from L929 fibroblasts expressing α1β3δ-γ2L(M1e) receptors (upper left), α1β3δ-γ2L(M1i) receptors (upper right), α1β3δ-γ2L(M2e) receptors (lower left), or α1β3δ-γ2L(M3e) receptors (lower right). GABA or GABA plus 10 μm Zn2+ was applied for 6-12 s (horizontal bars) to cells voltage clamped at -75 mV. B, concentration-response curves for cells expressing α1β3δ-γ2L(M1e) receptors (Δ), α1β3δ-γ2L(M1i) receptors (○), α1β3δ-γ2L(M2e) receptors (▴), and α1β3δ-γ2L(M3e) receptors (•) are shown by continuous lines. Concentration-response curves for wild-type α1β3δ (left) and α1β3γ2L (right) receptors are shown for comparison (dashed lines). The peak response to each concentration of Zn2+ was normalized as a percentage of the maximum current response to GABA alone for each cell. Values are means ±s.e.m. Data for each isoform were fitted with a four-parameter logistic equation with the indicated IC50 values and Hill slopes (nH).
Figure 5
Figure 5. Zn2+ sensitivity of GABARs containing M2 mutant subunits
A, M2 segment sequences for the rat α1, β3, γ2L and δ subunits are shown. Residue numbers are based on the mature protein amino acid sequences. Residues in the α1 and β3 subunits previously shown to be water accessible are underlined (Xu & Akabas, 1996; Horenstein & Akabas, 1998). The four sequence differences between the M2 segments of the γ2L and δ subunits are in bold and italicized. The triplets at the extracellular ends of the γ2L and δ M2 segments that were targeted for mutagenesis are underlined. B, representative whole-cell currents from L929 fibroblasts expressing α1β3δ(MVS → STI) receptors (left) and α1β3γ2L(STI → MVS) receptors (right). GABA or GABA plus 10 μm Zn2+ was applied for 7 s (horizontal bars) to cells voltage clamped at -75 mV. C, concentration-response curves for cells expressing α1β3δ(MVS → STI) receptors (•) and α1β3γ2L(STI → MVS) receptors (Δ). Concentration-response curves for wild-type α1β3δ (left) and α1β3γ2L (right) receptors are shown for comparison (dashed lines). The peak response to each concentration of Zn2+ was normalized as a percentage of the maximum current response to GABA alone for each cell. Values are means ±s.e.m. Data for each isoform were fitted with a four-parameter logistic equation with the indicated IC50 values and Hill slopes (nH).
Figure 6
Figure 6. Zn2+ sensitivity of GABARs containing subunits with M2 triplet mutations
A, representative whole-cell currents from L929 fibroblasts expressing α1β3δ(M278S) receptors (upper left), α1β3δ(V279T) receptors (upper right), α1β3δ(S280I) receptors (lower left), or α1β3γ2L(I282S) receptors (lower right). GABA or GABA plus 10 μm Zn2+ was applied for 7-12 s (horizontal bars) to cells voltage clamped at -75 mV. B, concentration-response curves for cells expressing α1β3δ(M278S) receptors (•), α1β3δ(V279T) receptors (▴), α1β3δ(S280I) receptors (○), or α1β3γ2L(I282S) receptors (Δ) are shown by continuous lines. Concentration-response curves for wild-type α1β3δ (left) and α1β3γ2L (right) receptors are shown for comparison (dashed lines). The peak response to each concentration of Zn2+ was normalized as a percentage of the maximum current response to GABA alone for each cell. Values are means ±s.e.m. Data for each isoform were fitted with a four-parameter logistic equation with the indicated IC50 values and Hill slopes (nH).
Figure 7
Figure 7. Zn2+ sensitivity of GABARs containing M2-M3 mutant subunits
A, M2-M3 loop sequences for the rat α1, α6, γ2L and δ subunits are shown. Residue numbers are based on the mature protein amino acid sequences. Residues in the α1 and α6 subunits previously shown to influence Zn2+ sensitivities of α1β3γ2L and α6β3γ2L receptors are underlined (Fisher & Macdonald, 1998). The homologous residues in the γ2L and δ subunits that were targeted for mutagenesis are in bold and italicized. B, representative whole-cell currents from L929 fibroblasts expressing α1β3δ(S283K) receptors (left) and α1β3γ2L(K285S) receptors (right). The indicated concentrations of GABA were applied for 6-8 s (horizontal bars) to cells voltage clamped at -75 mV. C, concentration-response curves for cells expressing α1β3δ(S283K) receptors (•) and α1β3γ2L(K285S) receptors (Δ). Concentration- response curves for wild-type α1β3δ (left) and α1β3γ2L (right) receptors are shown for comparison (dashed lines). The peak response to each concentration of Zn2+ was normalized as a percentage of the maximum current response to GABA alone for each cell. Values are means ±s.e.m. Data for each isoform were fitted with a four-parameter logistic equation with the indicated IC50 values and Hill slopes (nH).
Figure 8
Figure 8. Schematic representation of two domains of the γ2L subunit involved in conferring low Zn2+ sensitivity
The putative membrane topology of a γ2L subunit is shown. The extracellular N- and C-termini are indicated (N, C) and the four putative transmembrane segments labelled (M1-M4). The subunit domains involved in conferring low Zn2+ sensitivity to ternary GABARs are indicated by dashed lines with identified key residues (boxed text) shown in their approximate locations. The first domain (I) is composed of the N-terminal extracellular region. The second domain (II) is composed of a triplet of amino acid residues (STI) at the extracellular end of the M2 segment and a single residue (K) at the proximal end of the M2-M3 loop.

Similar articles

Cited by

References

    1. Angelotti TP, Uhler MD, Macdonald RL. Assembly of GABAA receptor subunits: analysis of transient single cell expression utilizing a fluorescent substrate/marker gene combination. Journal of Neuroscience. 1993;13:1418–1428. - PMC - PubMed
    1. Belelli D, Lambert JJ, Peters JA, Wafford K, Whiting PJ. The interaction of the general anesthetic etomidate with the γ-aminobutyric acid type A receptor is influenced by a single amino acid. Proceedings of the National Academy of Sciences of the USA. 1997;94:11031–11036. - PMC - PubMed
    1. Boileau AJ, Czajkowski C. Identification of transduction elements for benzodiazepine modulation of the GABAA receptors: three residues are required for allosteric coupling. Journal of Neuroscience. 1999;19:10213–10220. - PMC - PubMed
    1. Bonnert TP, McKernan RM, Farrar S, le Bourdelle B, Heavens RP, Smith DW, Hewson L, Rigby MR, Sirinathsinghji DJ, Brown N, Wafford KA, Whiting PJ. Theta, a novel gamma-aminobutyric acid type A receptor subunit. Proceedings of the National Academy of Sciences of the USA. 1999;96:9891–9896. - PMC - PubMed
    1. Burgard EC, Tietz EI, Neelands TR, Macdonald RL. Properties of recombinant γ-aminobutyric acidA receptor isoforms containing the α5 subunit subtype. Molecular Pharmacology. 1996;50:119–127. - PubMed

Publication types

MeSH terms