. 2001 Apr 1;532(Pt 1):143-63.
doi: 10.1111/j.1469-7793.2001.0143g.x.

Modulation of rat erg1, erg2, erg3 and HERG K+ currents by thyrotropin-releasing hormone in anterior pituitary cells via the native signal cascade

Affiliations

Modulation of rat erg1, erg2, erg3 and HERG K+ currents by thyrotropin-releasing hormone in anterior pituitary cells via the native signal cascade

W Schledermann et al. J Physiol. .

Abstract

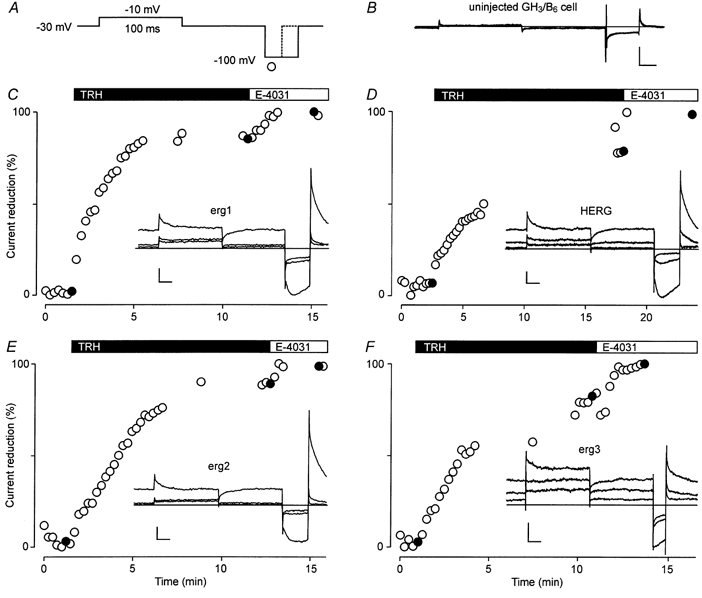
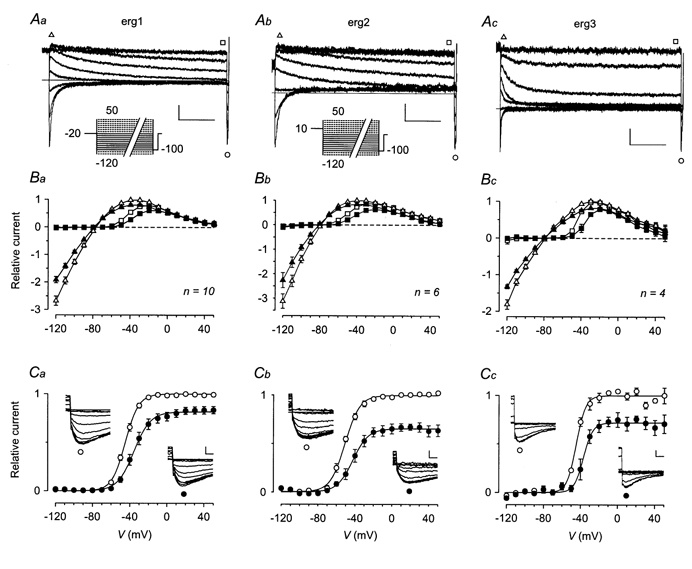
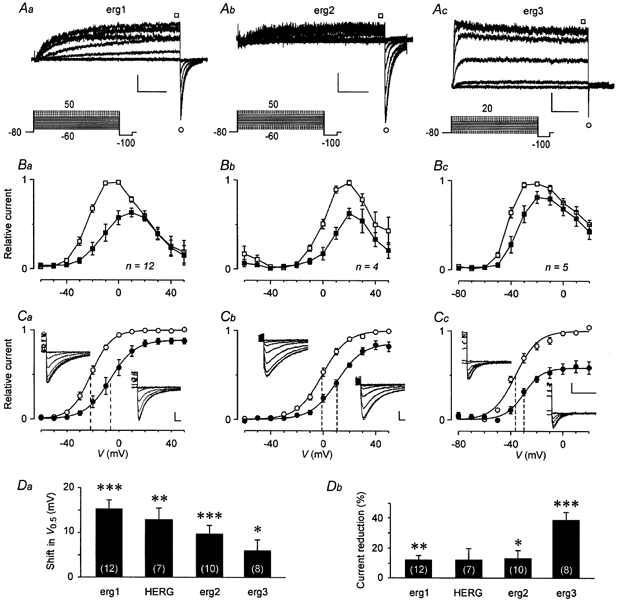
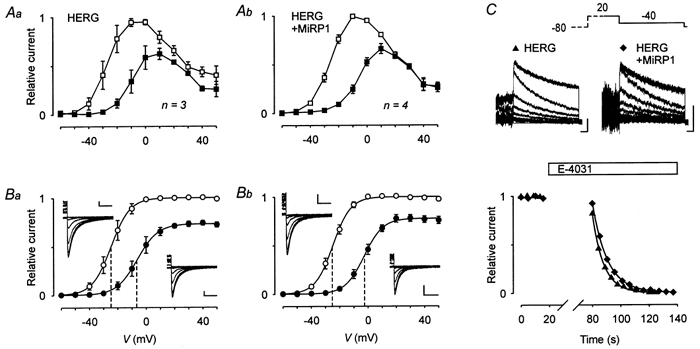
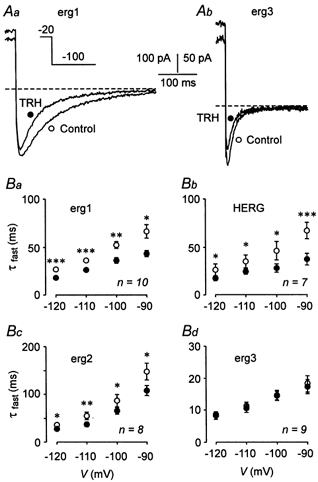
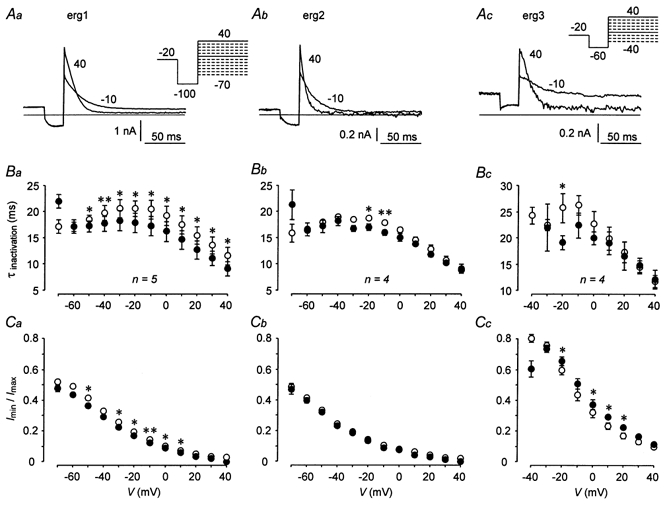
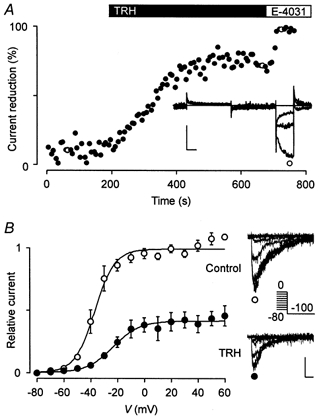
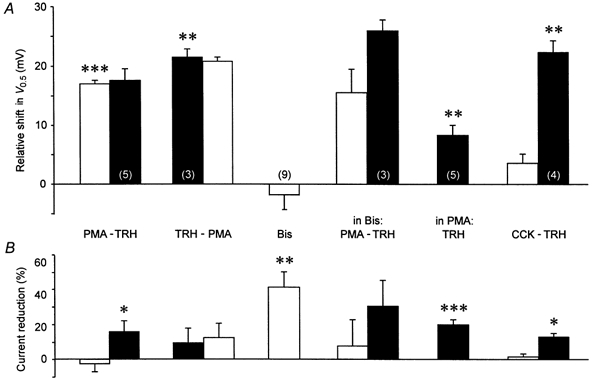
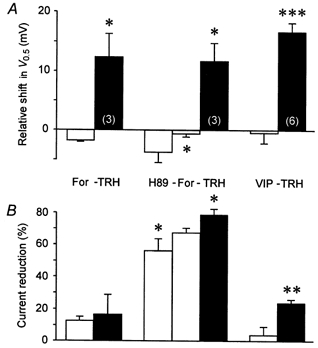
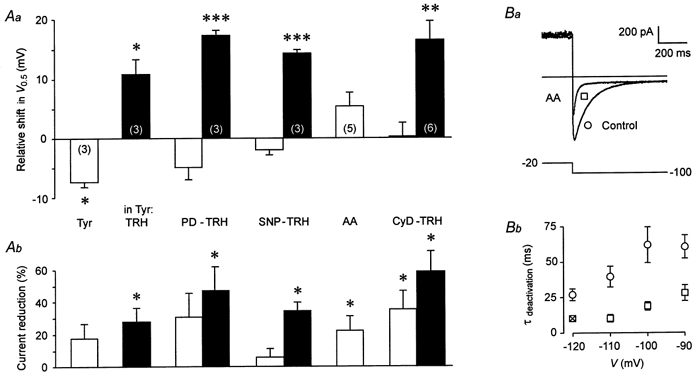
The mechanism of thyrotropin-releasing hormone (TRH)-induced ether-a-go-go-related gene (erg) K+ current modulation was investigated with the perforated-patch whole-cell technique in clonal somatomammotroph GH3/B6 cells. These cells express a small endogenous erg current known to be reduced by TRH. GH3/B6 cells were injected with cDNA coding for rat erg1, erg2, erg3 and HERG K+ channels. The corresponding erg currents were isolated with the help of the specific erg channel blockers E-4031 and dofetilide and their biophysical properties were determined. TRH (1 M) was able to significantly reduce the different erg currents. The voltage dependence of activation was shifted by 15 mV (erg1), 10 mV (erg2) and 6 mV (erg3) to more positive potentials without strongly affecting erg inactivation. TRH reduced the maximal available erg current amplitude by 12% (erg1), 13% (erg2) and 39% (erg3) and accelerated the time course of erg1 and erg2 channel deactivation, whereas erg3 deactivation kinetics were not significantly altered. The effects of TRH on HERG currents did not differ from those on its rat homologue erg1. In addition, coinjection of rat MiRP1 with HERG cDNA did not influence the TRH-induced modulation of HERG channels. Rat erg1 currents recorded in the cell-attached configuration were reduced by application of TRH to the extra-patch membrane in the majority of the experiments, confirming the involvement of a diffusible second messenger. Application of the phorbol ester phorbol 12-myristate 13-acetate (PMA; 1 M) shifted the voltage dependence of erg1 activation in the depolarizing direction, but it did not reduce the maximal current amplitude. The voltage shift could not be explained by a selective effect on protein kinase C (PKC) since the PKC inhibitor bisindolylmaleimide I did not block the effects of TRH and PMA on erg1. In addition, cholecystokinin, known to activate the phosphoinositol pathway similarly to TRH, did not significantly affect the erg1 current. Various agents interfering with different known TRH-elicited cellular responses were not able to completely mimic or inhibit the TRH effects on erg1. Tested substances included modulators of the cAMP-protein kinase A pathway, arachidonic acid, inhibitors of tyrosine kinase and mitogen-activated protein kinase, sodium nitroprusside and cytochalasin D. The results demonstrate that all three members of the erg channel subfamily are modulated by TRH in GH3/B6 cells. In agreement with previous studies on the TRH-induced modulation of the endogenous erg current in prolactin-secreting anterior pituitary cells, the TRH effects on overexpressed erg1 channels are not mediated by any of the tested signalling pathways.


Figures

Figure 1
Figure 1. Reduction of rat erg1, erg2, erg3 and HERG currents by TRH
Membrane currents were recorded in standard external 5 mm K+ solution in uninjected GH3/B6 cells (B) and in GH3/B6 cells previously injected with erg cDNA (insets in C-F) before and after application of 1 μm TRH and 10 μm E-4031. A, the standard test pulse sequence consisted of a 100 ms depolarizing pulse to -10 mV and a 40 ms hyperpolarizing pulse to -100 mV after a return to the holding potential of -30 mV for 100 ms. A shorter (20 ms) hyperpolarization was used for erg3 currents (F) to avoid substantial deactivation. C-F, time course of relative erg current reduction by TRH and E-4031 obtained from the maximal current amplitude during the hyperpolarization to -100 mV. Isolated erg currents were obtained by subtraction of the E-4031-insensitive currents from the recorded current traces. Filled circles correspond to the current traces shown in the insets. Vertical and horizontal scale bars denote 100 pA and 20 ms, respectively.
Figure 2
Figure 2. TRH shifts the potential dependence of erg current availability to more positive potentials
A, erg currents elicited in GH3/B6 cells previously injected with cDNA coding for rat erg1 (a), erg2 (b) and erg3 (c). The pulse protocol consisted of variable 5 s test pulses between 50 and -120 mV in steps of 10 mV from a holding potential of -20 mV. With a gap of 500 ms at -20 mV (for erg1 and erg3) or 10 mV (for erg2), a 2 s depolarizing prepulse to 20 mV (for erg1 and erg3) or 50 mV (for erg2) preceded the test pulses to activate the erg channels. For clarity, only current traces recorded with test pulses to potentials between -20 and -100 mV are shown. Continuous lines in the pulse protocols correspond to the selected current traces. The erg currents were isolated by subtraction of the E-4031-insensitive currents obtained after application of 10 μm E-4031 at the end of the experiments. B, I-V plots of the maximal erg current amplitudes (triangles) and the current amplitudes at the end of the 5 s test pulses (squares) before (open symbols) and after (filled symbols) TRH application. For potentials > -20 mV, erg current amplitudes were measured after inactivation had taken place. Data are means ±s.e.m. of erg current amplitudes normalized to the respective maximal outward current amplitude. C, plots of the maximal erg current amplitude elicited with the constant hyperpolarizing pulse to -100 mV against the preceding test pulse potential. Mean relative current amplitudes (means ±s.e.m.) obtained from the same experiments as shown in B are given before (○) and after (•) TRH application and the continuous lines represent Boltzmann functions fitted to the data points. Values for the inflection potential and steepness are, respectively: for erg1, -44.8 mV and 7.2 mV (control) and -35.5 mV and 8.9 mV (TRH); for erg2, -50.7 mV and 8.0 mV (control) and -42.3 mV and 8.4 mV (TRH); for erg 3, -44.4 mV and 5.0 mV (control) and -36.7 mV and 5.0 mV (TRH). The insets show erg current traces elicited at -100 mV following test pulses to potentials between 10 and -80 mV (erg1), between 50 and -90 mV (erg2) and between -10 and -80 mV (erg3) before (○) and after (•) TRH. Data from the same experiments as given in A on an expanded time scale. Vertical and horizontal scale bars denote 100 pA and 1 s in A, and 100 pA and 10 ms in C.
Figure 3
Figure 3. TRH shifts erg activation curves and reduces the maximal erg current amplitude
A, erg currents elicited from a holding potential of -80 mV in GH3/B6 cells previously injected with cDNA coding for rat erg1 (a), erg2 (b) and erg3 (c). Continuous lines in the pulse protocols correspond to the selected current traces. The erg currents were isolated with the help of E-4031. Vertical and horizontal scale bars denote 100 pA and 1 s. B, I-V plots of the relative current amplitudes (means ±s.e.m.) at the end of the 5 s test pulses before (□) and after (▪) TRH application. Current amplitudes were normalized to the maximal erg outward current amplitude. C, plots of the maximal erg current amplitude elicited with the constant hyperpolarizing pulse to -100 mV against the preceding test pulse potential. Mean relative current amplitudes (means ±s.e.m.) are given before (○) and after (•) TRH application and the continuous lines represent Boltzmann functions fitted to the data points. Values for the inflection potential (V0.5, indicated by vertical dashed lines) and steepness are, respectively: for erg1, -21.4 mV and 7.8 mV (control) and -6.7 mV and 9.6 mV (TRH); for erg2, -0.8 mV and 9.5 mV (control) and 10.5 mV and 9.8 mV (TRH); for erg 3, -36.3 mV and 8.6 mV (control) and -29.9 mV and 7.1 mV (TRH). The insets show erg current traces recorded at -100 mV following test pulses to potentials between 30 and -60 mV (Ca), 40 and -30 mV (Cb), and 10 and -60 mV (Cc) before (on the left side of the plots) and after TRH (on the right). Data from the same experiments as given in A on an expanded time scale. Vertical and horizontal scale bars denote 100 pA and 50 ms. D, comparison of the TRH-induced shift in the voltage dependence of erg current activation (Da) and the reduction in the maximal available erg current (Db) obtained for rat erg1, HERG, rat erg2 and rat erg3. The values for the rat erg channels are derived from the data shown in C. *P≤ 0.05, **P≤ 0.01, ***P≤ 0.001, significant differences with two-tailed paired t test. Numbers in parentheses indicate the number of experiments.
Figure 4
Figure 4. Coexpression of rat MiRP1 does not change the TRH effects on HERG
The voltage dependence of HERG current activation before and after TRH application was determined in GH3/B6 cells injected with cDNA coding for HERG (Aa and Ba) or with cDNAs coding for HERG and rat MiRP1 (Ab and Bb) 1 day prior to the experiments using the same pulse protocol as in Fig. 3. The currents were isolated with the help of E-4031. A, I-V plots of the relative current amplitudes (means ±s.e.m.) at the end of the 5 s test pulses before (□) and after (▪) TRH application. Current amplitudes were normalized to the maximal outward current amplitude. B, plots of the maximal erg current amplitude elicited with the constant hyperpolarizing pulse to -100 mV against the preceding test pulse potential. Mean relative current amplitudes (means ±s.e.m.) are given before (○) and after (•) TRH application. The continuous lines represent Boltzmann functions fitted to the data points. Values for the inflection potential (V0.5, indicated by vertical dashed lines) and steepness are, respectively: for HERG, -24.8 mV and 6.2 mV (control) and -6.2 mV and 7.3 mV (TRH); for HERG + MiRP1, -24.8 mV and 6.4 mV (control) and -2.7 mV and 6.6 mV (TRH). The insets show current traces recorded at -100 mV following test pulses to potentials between 30 and -60 mV before (on the left side of the plots) and after TRH (on the right). Vertical and horizontal scale bars denote 100 pA and 100 ms. C, examples of superimposed erg current traces recorded from cells injected with cDNA coding for HERG or for HERG + MiRP1 before and more than 60 s after application of 1 μm E-4031 at the end of the experiments. The currents were elicited with a 2 s test pulse to -40 mV after a 1 s depolarization to 20 mV from a holding potential of -80 mV. Vertical and horizontal scale bars denote 100 pA and 100 ms. The time course of the E-4031-induced reduction in the tail current amplitudes was fitted with a single exponential function yielding time constants of 7.9 and 10.5 s for the cells injected with cDNA for HERG and HERG + MiRP1, respectively.
Figure 5
Figure 5. Effects of TRH on erg1, HERG, erg2 and erg3 fast deactivation kinetics
Superimposed erg1 (Aa) and erg3 (Ab) current traces before (○) and after (•) application of 1 μm TRH. The erg currents were isolated using E-4031. The time course of erg current increase and subsequent decay upon hyperpolarizing pulses from a holding potential of -20 mV was fitted by the sum of three exponential functions corresponding to the process of recovery from inactivation as well as to fast and slow deactivation kinetics. B, voltage dependence of the mean time constants of fast deactivation before and after application of TRH obtained in GH3/B6 cells injected with cDNA for rat erg1 (Ba), erg2 (Bc), erg3 (Bd) and HERG (Bb). *P≤ 0.05, **P≤ 0.01 and ***P≤ 0.001, significant differences before and after TRH with one-tailed paired t test.
Figure 6
Figure 6. Effects of TRH on rat erg1, erg2 and erg3 current inactivation
Rat erg1 (Aa), erg2 (Ab) and erg3 (Ac) current traces elicited with variable test pulses to 40 mV and -10 mV are shown. The erg currents were isolated using E-4031 as specific blocker. The holding potential was -20 mV and a 2 s prepulse to 20 mV preceded the pulse sequences to activate the erg channels. For erg1 and erg2, a 25 ms pulse to -100 mV was used to allow the erg channels to recover from inactivation. For erg3, the corresponding pulse was set to -60 mV due to the fast deactivation of erg3 channels at more negative potentials. The time course of erg current decay upon the variable test pulses was fitted by a single exponential function. The first few milliseconds during which capacitive transients occurred in the original traces were not used for the fit procedure. B, voltage dependence of the time constants of inactivation (means ±s.e.m.) before (○) and after (•) application of 1 μm TRH obtained in GH3/B6 cells injected with cDNA coding for rat erg1 (Ba), erg2 (Bb) and erg3 (Bc). The value for erg3 current decay at -40 mV after TRH (147 ± 45.5 ms) is out of scale due to the onset of deactivation. C, voltage dependence of the ratio of steady-state current to maximal erg current (means ±s.e.m.) before (○) and after (•) application of TRH. The values of Imin and Imax were obtained with the fit procedure. *P≤ 0.05, **P≤ 0.01, significant differences before and after TRH with two-tailed paired t test.
Figure 7
Figure 7. TRH affects rat erg1 currents measured in the cell-attached mode
A, membrane currents of a GH3/B6 cell injected with rat erg1 cDNA were recorded in the cell-attached mode in external (bath and pipette) 150 mm K+ solution before and after subsequent application of 1 μm TRH and 10 μm E-4031 (inset). The test pulse sequence was similar to that described in Fig. 1, the holding potential was -30 mV. The time course of relative erg current reduction by TRH and E-4031 was obtained from the maximal current amplitude during the hyperpolarization to -100 mV. The erg currents were isolated with the help of E-4031. The open circles correspond to the current traces shown in the inset. Vertical and horizontal scale bars denote 100 pA and 20 ms, respectively. B, TRH effects on the potential dependence of rat erg1 current activation. Mean (±s.e.m.) relative values of the maximal erg current amplitude elicited with a constant hyperpolarizing pulse to -100 mV before (○) and after (•) TRH application are plotted against the potential of the preceding 5 s test pulse. The pulse protocol and data evaluation were as described in Fig. 3, the holding potential was -80 mV. The continuous lines represent Boltzmann functions fitted to the data points. Values for the inflection potential and steepness are, respectively, -37.1 mV and 7.5 mV (control) and -23.2 mV and 9.8 mV (TRH). Data from 4 of 6 experiments where TRH produced a clear effect (as shown in A). The insets show erg1 current traces recorded at -100 mV following 5 s test pulses to potentials between 0 and -80 mV before and after TRH application.
Figure 8
Figure 8. Effects of substances affecting protein kinase C on the TRH response of rat erg1
Evaluation of the effects of acute application of the phorbol ester PMA, TRH, bisindolylmaleimide I (Bis) and cholecystokinin (CCK) on the voltage dependence of rat erg1 current activation (A) and the reduction in the maximal available erg current (B). In PMA, preincubation of the cells for 17.5-24 h in 1 μm PMA; In Bis, preincubation of the GH3/B6 cells in bisindolylmaleimide I for 1.5-2.5 h. Pulse protocol and data evaluation were as described in Fig. 3. Test substances were subsequently applied when the effect on the erg current measured with the test pulse sequence (see Fig. 1) reached a plateau. At the end of the experiments, either 10 μm E-4031 or 10 μm dofetilide was applied to allow subtraction of the drug-insensitive currents. *P≤ 0.05, **P≤ 0.01, ***P≤ 0.001, significant differences between subsequent measurements with two-tailed paired t test (except for TRH: one-tailed t test). Numbers in parentheses indicate the number of experiments.
Figure 9
Figure 9. Agents affecting protein kinase A do not affect the TRH-induced modulation of rat erg1
Evaluation of the effects of application of forskolin (For), H-89, VIP and TRH on the voltage dependence of rat erg1 current activation (A) and the relative amplitude of the maximal available erg current (B). Pulse protocol and data evaluation were as described in Fig. 3. *P≤ 0.05, **P≤ 0.01, ***P≤ 0.001, significant differences between subsequent measurements with two-tailed paired t test (except for TRH: one-tailed t test). Numbers in parentheses indicate the number of experiments.
Figure 10
Figure 10. Effects on rat erg1 of substances interacting with known cellular responses to TRH
Comparison of the effects of tyrphostin A23 (Tyr), PD 98059 (PD), SNP, arachidonic acid (AA), cytochalasin D (CyD) and subsequent application of TRH on the voltage dependence of rat erg1 current activation (Aa) and the relative amplitude of the maximal available erg current (Ab). In Tyr, cells were preincubated in tyrphostin A23 for 1.5-4.5 h. Pulse protocol and data evaluation as described in Fig. 3. *P≤ 0.05, **P≤ 0.01, ***P≤ 0.001, significant differences with two-tailed paired t test (except for TRH: one-tailed t test). Ba, the time course of erg1 current deactivation was accelerated by arachidonic acid. Bb, voltage dependence of the mean time constants of fast deactivation before and after application of arachidonic acid. Data are means ±s.e.m. (n = 3, except n = 1 indicated by X). The time course of current increase and subsequent decay upon hyperpolarizing pulses from a holding potential of -20 mV was fitted by the sum of three exponential functions corresponding to the process of recovery from inactivation as well as to fast and slow deactivation kinetics.

Similar articles

Cited by

References

    1. Abbott GW, Sesti F, Splawski I, Buck ME, Lehmann MH, Timothy KW, Keating MT, Goldstein SAN. MiRP1 forms IKr potassium channels with HERG and is associated with cardiac arrhythmia. Cell. 1999;97:175–187. - PubMed
    1. Aragay AM, Katz A, Simon MI. The Gαq and Gα11 proteins couple the thyrotropin-releasing hormone receptor to phospholipase C in GH3 rat pituitary cells. Journal of Biological Chemistry. 1992;267:24983–24988. - PubMed
    1. Barros F, del Camino D, Pardo LA, Palomero T, Giráldez T, dela Peña P. Demonstration of an inwardly rectifying K+ current component modulated by thyrotropin-releasing hormone and caffeine in GH3 rat anterior pituitary cells. Pflügers Archiv. 1997;435:119–129. - PubMed
    1. Barros F, Delgado LM, del Camino D, de la Peña P. Characteristics and modulation by thyrotropin-releasing hormone of an inwardly rectifying K+ current in patch-perforated GH3 anterior pituitary cells. Pflügers Archiv. 1992;422:31–39. - PubMed
    1. Barros F, GómeZ-Varela D, Viloria CG, Palomero T, Giráldez T, de la Peña P. Modulation of human erg K+ channel gating by activation of a G-protein-coupled receptor and protein kinase C. Journal of Physiology. 1998;511:333–346. - PMC - PubMed

Publication types

MeSH terms

Substances

LinkOut - more resources