. 2001 Apr;21(8):2867-79.
doi: 10.1128/MCB.21.8.2867-2879.2001.

Long-range nucleosome ordering is associated with gene silencing in Drosophila melanogaster pericentric heterochromatin

Affiliations

Long-range nucleosome ordering is associated with gene silencing in Drosophila melanogaster pericentric heterochromatin

F L Sun et al. Mol Cell Biol. 2001 Apr.

Abstract

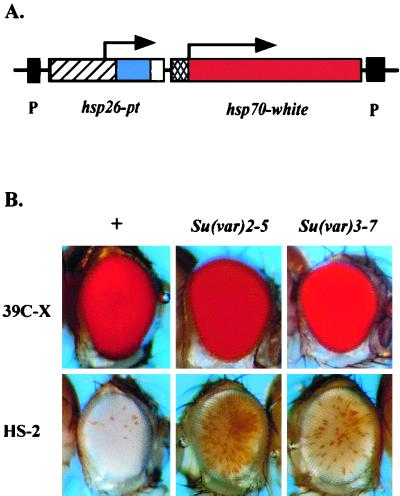
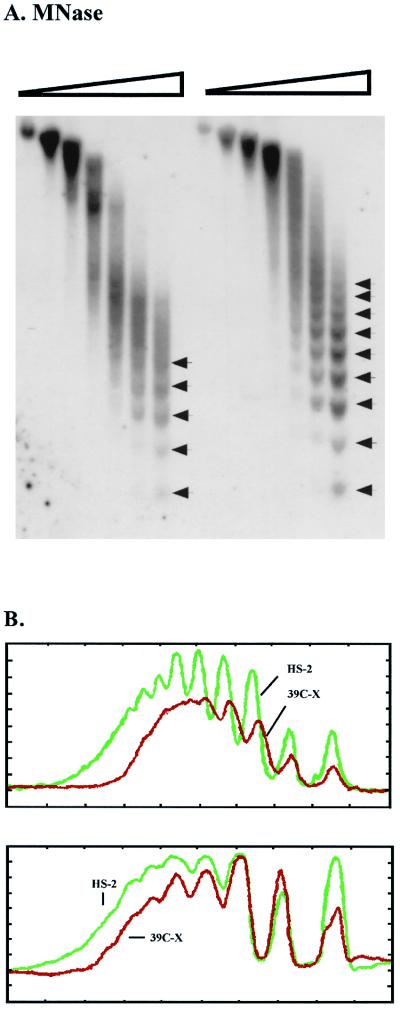
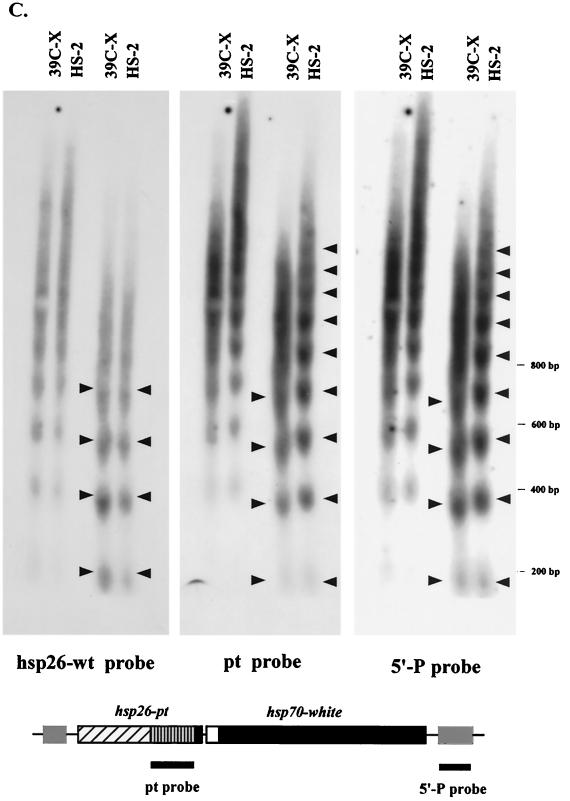
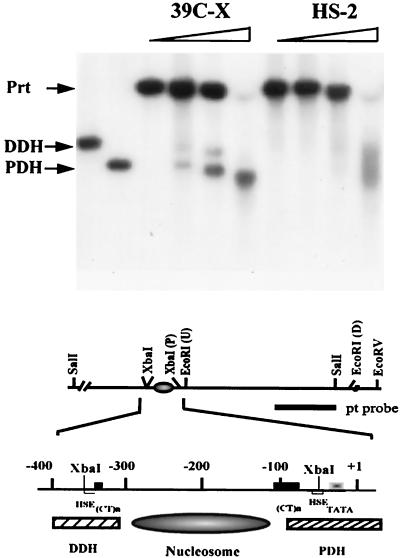
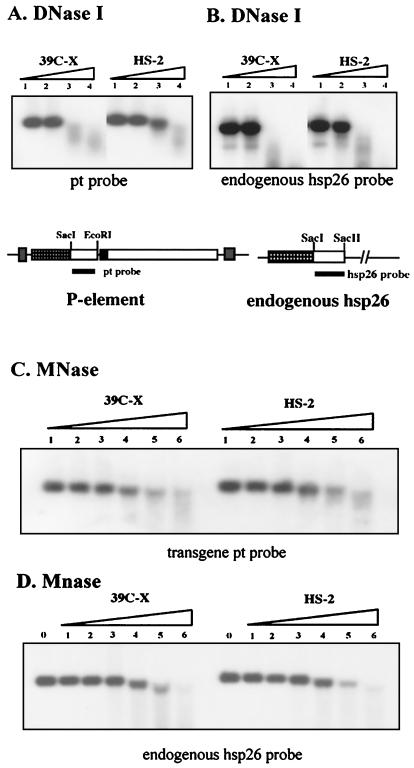
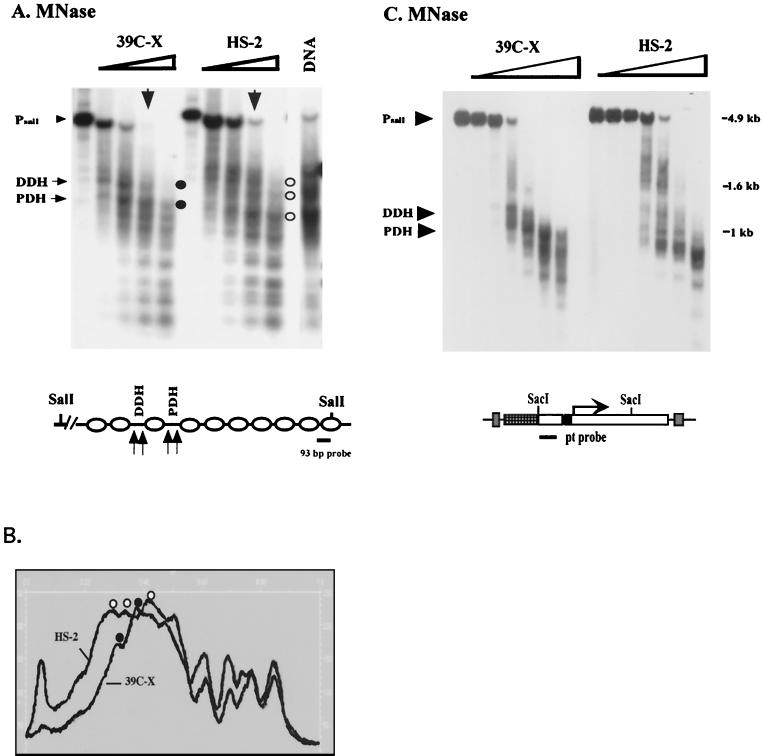
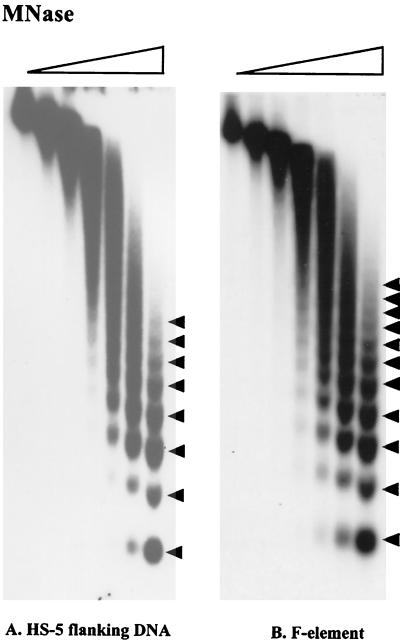
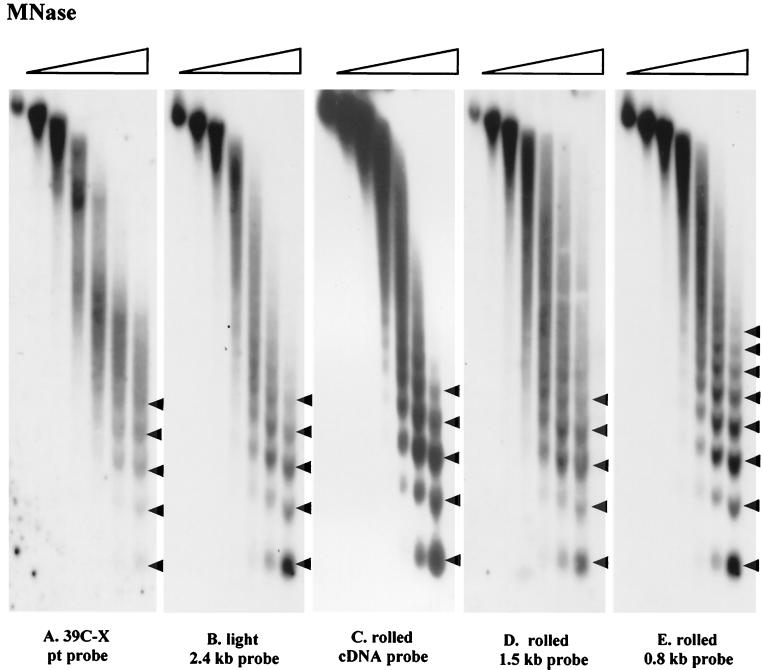
We have used line HS-2 of Drosophila melanogaster, carrying a silenced transgene in the pericentric heterochromatin, to investigate in detail the chromatin structure imposed by this environment. Digestion of the chromatin with micrococcal nuclease (MNase) shows a nucleosome array with extensive long-range order, indicating regular spacing, and with well-defined MNase cleavage fragments, indicating a smaller MNase target in the linker region. The repeating unit is ca. 10 bp larger than that observed for bulk Drosophila chromatin. The silenced transgene shows both a loss of DNase I-hypersensitive sites and decreased sensitivity to DNase I digestion within an array of nucleosomes lacking such sites; within such an array, sensitivity to digestion by MNase is unchanged. The ordered nucleosome array extends across the regulatory region of the transgene, a shift that could explain the loss of transgene expression in heterochromatin. Highly regular nucleosome arrays are observed over several endogenous heterochromatic sequences, indicating that this is a general feature of heterochromatin. However, genes normally active within heterochromatin (rolled and light) do not show this pattern, suggesting that the altered chromatin structure observed is associated with regions that are silent, rather than being a property of the domain as a whole. The results indicate that long-range nucleosomal ordering is linked with the heterochromatic packaging that imposes gene silencing.


Figures

FIG. 1
FIG. 1
Silencing of the hsp70-white transgene in line HS-2 is suppressed by known Su(var) mutations. (A) Map of the P-element construct used. The 3′ and 5′ P-element ends (black boxes), hsp26 gene fragment (hatched box), pt (barley gene) fragment (blue box), termination signal (white box), hsp70 promoter region (cross-hatched box), and white gene fragment (red box) are diagrammed. (B) Control line 39C-X carries the P element in a euchromatic site, while HS-2 has the P element inserted into pericentric heterochromatin. The HS-2 transgene shows loss of silencing in the presence of the Su(var)2-502 and Su(var)3-7 mutations, while expression of the 39C-X transgene is unaffected.
FIG. 2
FIG. 2
MNase digestion reveals long-range nucleosomal ordering, with an altered repeat size, at the silenced transgene. (A) Nuclei isolated from 6- to 18-h-old embryos from lines 39C-X and HS-2 were treated with increasing amounts of MNase (concentrations of 0, 0.01, 0.02, 0.04, 0.08, 0.12, and 0.24 U/μl), and the DNA was purified and run in a 1.5% agarose gel. The DNA was transferred to a positively charged nylon membrane, and the membrane was hybridized with α-32P-labeled pt fragment. Linker sites cleaved by MNase are indicated by arrows. (B) Densitometric scans from the last lane of each sample set are compared (top to bottom of each lane is left to right along the x axis), aligned at the position of the mononucleosome (top panel). The same blot used in panel A was stripped and rehybridized with a 0.8-kb PvuII-SacII fragment from the 3′ coding region of the endogenous hsp26 gene as a control panel. Densitometric scans from the last lane of this sample set are shown (bottom (data not shown)). (C) The DNA samples used for the last two lanes of each set in panel A were run in parallel on a 1.8% agarose gel. The blot was hybridized with the 0.8-kb PvuII-SacII fragment from the endogenous hsp26 coding region (left), stripped, and rehybridized with the pt DNA fragment (center) or with a fragment from the 5′ end of the P element (right). The positions of molecular size markers are indicated to the right of the gels. The map below the gels indicates the probes used for the center and right panels.
FIG. 2
FIG. 2
MNase digestion reveals long-range nucleosomal ordering, with an altered repeat size, at the silenced transgene. (A) Nuclei isolated from 6- to 18-h-old embryos from lines 39C-X and HS-2 were treated with increasing amounts of MNase (concentrations of 0, 0.01, 0.02, 0.04, 0.08, 0.12, and 0.24 U/μl), and the DNA was purified and run in a 1.5% agarose gel. The DNA was transferred to a positively charged nylon membrane, and the membrane was hybridized with α-32P-labeled pt fragment. Linker sites cleaved by MNase are indicated by arrows. (B) Densitometric scans from the last lane of each sample set are compared (top to bottom of each lane is left to right along the x axis), aligned at the position of the mononucleosome (top panel). The same blot used in panel A was stripped and rehybridized with a 0.8-kb PvuII-SacII fragment from the 3′ coding region of the endogenous hsp26 gene as a control panel. Densitometric scans from the last lane of this sample set are shown (bottom (data not shown)). (C) The DNA samples used for the last two lanes of each set in panel A were run in parallel on a 1.8% agarose gel. The blot was hybridized with the 0.8-kb PvuII-SacII fragment from the endogenous hsp26 coding region (left), stripped, and rehybridized with the pt DNA fragment (center) or with a fragment from the 5′ end of the P element (right). The positions of molecular size markers are indicated to the right of the gels. The map below the gels indicates the probes used for the center and right panels.
FIG. 3
FIG. 3
Configuration of DH sites in the heterochromatic transgene. Nuclei isolated from third instar larvae were incubated with DNase I at concentrations of 0, 0.03, 0.06, and 0.12 U/μl. Purified DNA was cleaved with SalI, and the fragments were analyzed by Southern blotting using the pt DNA fragment as the hybridization probe. Proximal (PDH) and distal (DDH) DH sites are indicated; the parental band, which is created by SalI digestion of the DNA not cleaved in nuclei by DNase I, is indicated (Prt). A partial restriction map of the hsp26 transgene is shown below: the (CT)n regions (black box), heat shock elements (HSE) (white box), the TATA box (gradient box), the PDH site (hatched box), the DDH site (hatched box), and the positioned nucleosome between the PDH and the DDH are diagrammed.
FIG. 4
FIG. 4
A nucleosome array in heterochromatin is resistant to digestion with DNase I, but not with MNase. (A) Nuclei from 6- to 18-h-old non-heat-shocked embryos (lines 39C-X and HS-2) were treated with DNase I at concentrations of 0.016, 0.032, 0.064, or 0.128 U/μl. Purified DNA was then cut with SacI and EcoRI, and the presence of the 1-kb restriction fragment was monitored using Southern blotting with the pt DNA fragment as a probe. (B) In the control experiment, the digested DNA was cut with SacI and SacII, and a 0.8-kb DNA fragment from the 3′ portion of the endogenous hsp26 gene was used as a probe. (C) An analogous experiment used MNase at concentrations of 0, 0.01, 0.02, 0.04, 0.08, 0.12, and 0.24 U/μl to digest the chromatin in nuclei. The pt DNA fragment was used as a probe. (D) The control experiment performed as described above for panel B to monitor disappearance of the SacI-SacII fragment of the endogenous hsp26 gene shows that digestion of the chromatin from the two lines occurred at the same rate.
FIG. 5
FIG. 5
Mapping nucleosome positions in the heterochromatic transgenes using the indirect end labeling technique. (A) Nuclei isolated from 6- to 18-h-old embryos of lines 39C-X and HS-2 were treated with MNase (concentrations 0, 0.04, 0.08, 0.12, and 0.24 U/μl). The purified DNA was cut with SalI, size separated by gel electrophoresis, and transferred to a positively charged nylon membrane, and the membrane was hybridized with a 93-bp fragment from the barley cDNA to map the hsp26-pt transgene. The positions of the proximal and distal hypersensitive sites (PDH and DDH, respectively) in the 39C-X samples are indicated. Control digestion of purified DNA was performed as described in Materials and Methods. A map of the hsp26-pt transgene, indicating the position of the probe, is shown below the gel. (B) A scan of the MNase (0.12 U/μl) digest samples, showing the shift in pattern at the 5′ regulatory region of the gene. Accessible sites in 39C-X (black circles) and HS-2 (white circles) are indicated. (C) DNA samples from a MNase digest done as described above were cut with SacI and SacII, and the DNA samples were size separated by gel electrophoresis, transferred to a nylon filter, and hybridized with the pt DNA fragment to map the hsp70-white transgene. The parental DNA fragment (Prt) and the 5′ DH sites are indicated. The SacI and SacII restriction sites in the P element are shown on the map below.
FIG. 6
FIG. 6
Nucleosome arrays associated with heterochromatic DNA sequences. Blots containing DNA samples from nuclei digested with MNase as described in the legend to Fig. 2 were hybridized with a 1-kb DNA fragment that flanks the HS-5 insertion site (A) or a 4.5-kb F-element fragment (B). Linker sites cleaved by MNase are indicated by arrowheads.
FIG. 7
FIG. 7
Nucleosome arrays associated with genes active in heterochromatin compared to the euchromatic transgene. Blots containing DNA samples from nuclei digested with MNase as described in the legend to Fig. 2 were hybridized with a 2.4-kb BamHI-PstI fragment encompassing most of the first exon and ca. 1 kb of upstream DNA at light (20) (B), a 1.4-kb rolled gene cDNA (C), a 1,463-bp fragment starting at position +106 and extending upstream, encompassing the putative 5′ regulatory region of rolled (D), and a 813-bp fragment located 14038 bp upstream of the rolled gene start site (E). The fragments used for panels D and E were prepared by PCR from NCBI clone AE003090. Panel A shows the nucleosome array of the transgene in a euchromatic site (line 39C-X) for reference.

Similar articles

Cited by

References

    1. Allshire R C, Javerzat J-P, Redhead N J, Cranston G. Position effect variegation at the fission yeast centromere. Cell. 1994;76:157–169. - PubMed
    1. Almer A, Horz W. Nuclease hypersensitive regions with adjacent positioned nucleosomes mark the gene boundaries of the PHO5/PHO3 locus in yeast. EMBO J. 1986;5:268–287. - PMC - PubMed
    1. Bellard M, Gannon F, Chambon P. Nucleosome structure III: the structure and transcriptional activity of the chromatin containing the ovalbumin and globin genes in chick oviduct nuclei. Cold Spring Harbor Symp Quant Biol. 1978;2:779–791. - PubMed
    1. Berghella L, Dimitri P. The heterochromatic rolled gene of Drosophila melanogaster is extensively polytenized and transcriptionally active in the salivary gland chromocenter. Genetics. 1996;144:117–125. - PMC - PubMed
    1. Bi X, Broach J R. DNA in transcriptionally silent chromatin assumes a distinct topology that is sensitive to cell cycle progression. Mol Cell Biol. 1997;17:7077–7087. - PMC - PubMed

Publication types

LinkOut - more resources