. 2001 Apr;13(4):755-68.
doi: 10.1105/tpc.13.4.755.

A cell plate-specific callose synthase and its interaction with phragmoplastin

Affiliations

A cell plate-specific callose synthase and its interaction with phragmoplastin

Z Hong et al. Plant Cell. 2001 Apr.

Abstract

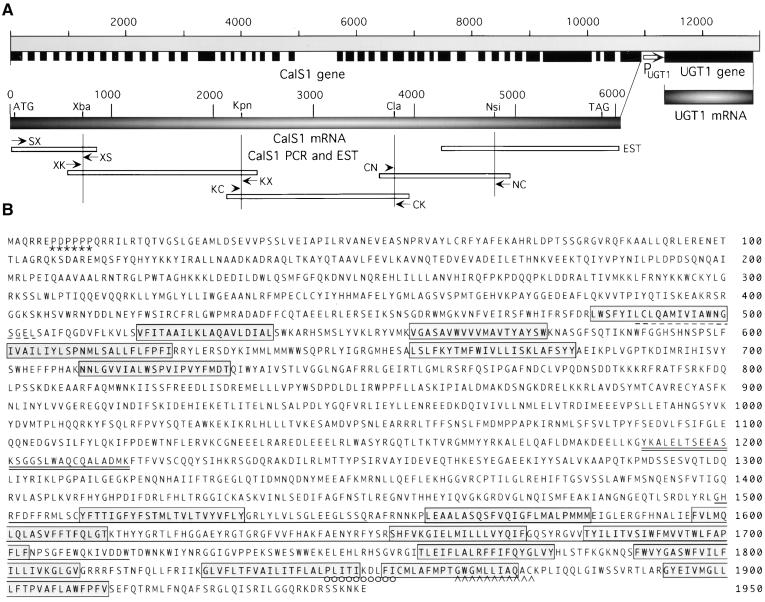
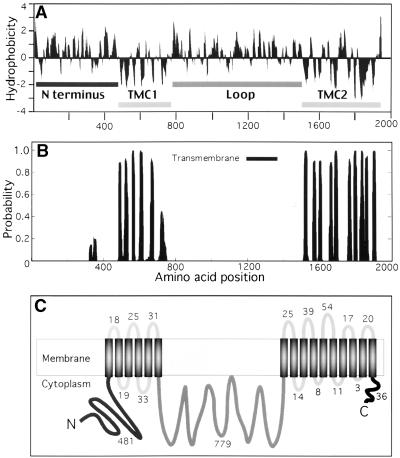
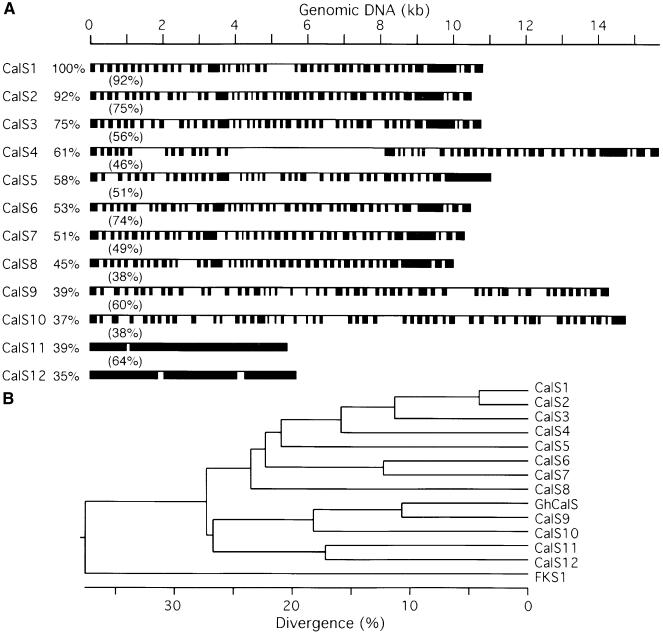
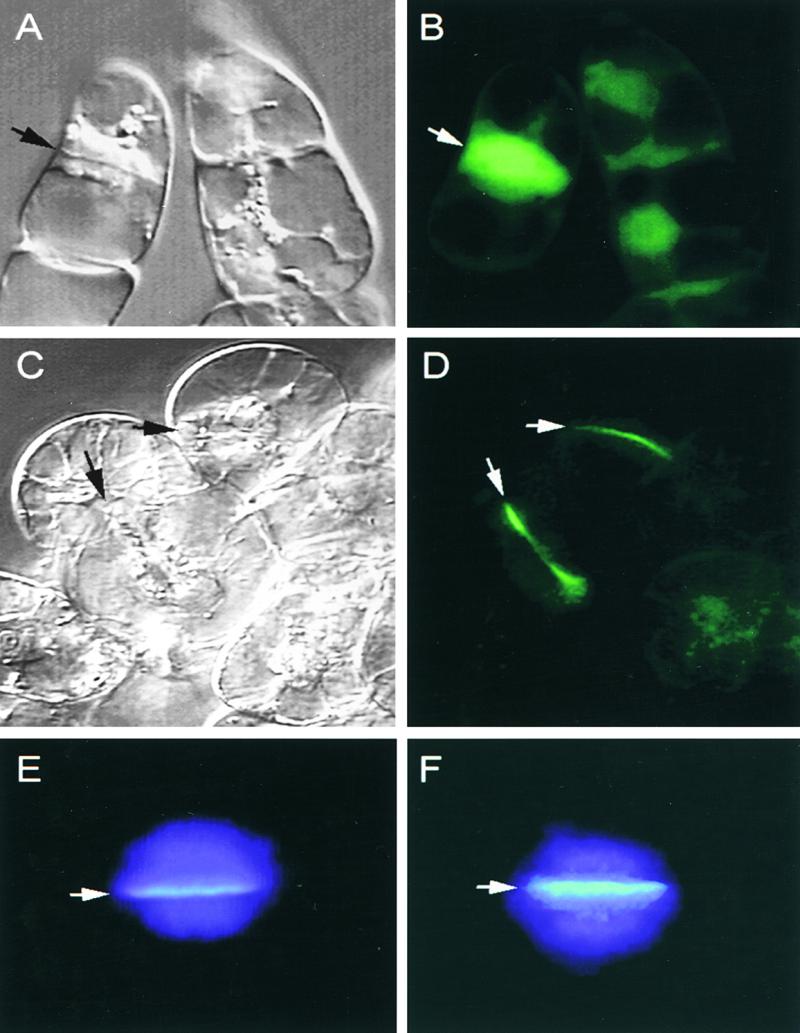
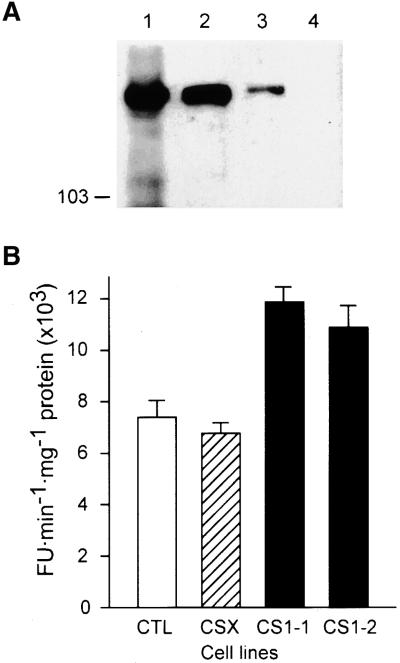
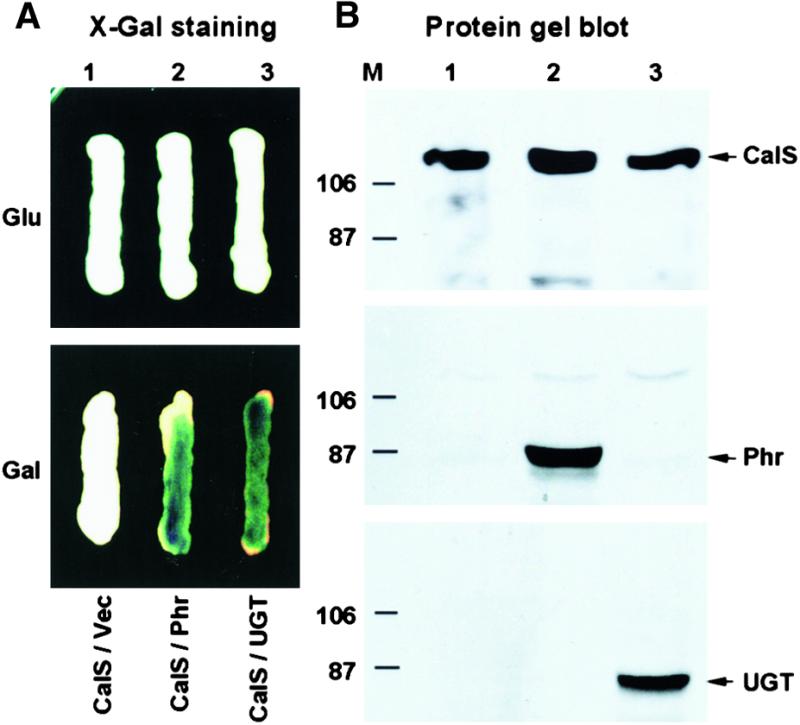
Callose is synthesized on the forming cell plate and several other locations in the plant. We cloned an Arabidopsis cDNA encoding a callose synthase (CalS1) catalytic subunit. The CalS1 gene comprises 42 exons with 41 introns and is transcribed into a 6.0-kb mRNA. The deduced peptide, with an approximate molecular mass of 226 kD, showed sequence homology with the yeast 1,3-beta-glucan synthases and is distinct from plant cellulose synthases. CalS1 contains 16 predicted transmembrane helices with the N-terminal region and a large central loop facing the cytoplasm. CalS1 interacts with two cell plate--associated proteins, phragmoplastin and a novel UDP-glucose transferase that copurifies with the CalS complex. That CalS1 is a cell plate--specific enzyme is demonstrated by the observations that the green fluorescent protein--CalS1 fusion protein was localized at the growing cell plate, that expression of CalS1 in transgenic tobacco cells enhanced callose synthesis on the forming cell plate, and that these cell lines exhibited higher levels of CalS activity. These data also suggest that plant CalS may form a complex with UDP-glucose transferase to facilitate the transfer of substrate for callose synthesis.


Figures

Figure 1.
Figure 1.
Gene Structure and Peptide Sequence of the Cell Plate–Specific Callose Synthase (CalS1). (A) Four fragments of the CalS1 cDNA were amplified by RT-PCR using specific primers (small arrows) and RNA from apical meristems of Arabidopsis seedlings. The cDNA was assembled from the PCR fragments and an EST clone (ATTS5466) through unique restriction enzyme sites. Exons are indicated by solid boxes. The larger arrow indicates the 450-bp promoter region (PUGT1) of UGT1. (B) The deduced amino acid sequence of CalS1 contains 16 transmembrane helices (boxed). The region between positions 1499 and 1717 that shares homology with the yeast GNS1 protein is underlined. A G-protein–coupled receptor signature is marked by a dashed line, and an inner membrane protein signature of the “binding protein–dependent transport system” (Saurin et al., 1994) is double underlined. A proline-rich domain near the N terminus is marked by asterisks. An energy transfer protein signature is indicated by open circles, and a possible lipid attachment motif of membrane lipoproteins is indicated by carets. The GenBank accession number for UGT1 is AF237733.
Figure 2.
Figure 2.
Predicted Membrane Topology Model of CalS1. (A) Hydrophobicity plot by the Kyte-Doolittle method. TMC1 and TMC2, transmembrane clusters 1 and 2. (B) Transmembrane helices predicted by the transmembrane hidden Markov model (TMHMM) program. (C) Topology of CalS1 in membrane. The long rectangle indicates the membrane, and the vertical black bars represent the transmembrane helices of CalS1. The length of the peptide chain in each non-membrane-spanning segment is indicated by the number of amino acid residues.
Figure 3.
Figure 3.
Homologs of CalS1 in the Arabidopsis Genome. (A) Genomic organization of Arabidopsis CalSs. Exons (solid boxes) of CalS1 were generated from the comparison of the cloned CalS1 cDNA and its genomic DNA (solid line). Exons of the rest of the CalSs were predicted by a combination of different software programs. The percentage of amino acid identity with CalS1 is shown before each gene, whereas the percentages in parentheses indicate amino acid identity between adjacent genes. A similar analysis has been performed independently by C. Somerville's group (see http://cellwall.stanford.edu/gsl/arabidopsis/structure.shtml). (B) Phylogenetic tree of putative CalSs from Arabidopsis. Protein sequences of Arabidopsis CalSs were compiled using the Clustal method of the DNAStar MegAlign program. The putative cotton fiber–related CalS (GhCalS; GenBank accession number AF085717) and yeast 1,3-β-glucan synthase (FKS1; GenBank accession number SCU12893) are included. Numbers on the horizontal scale indicate percentage of divergence.
Figure 4.
Figure 4.
Subcellular Localization of CalS1 and Deposition of Callose on the Cell Plate. (A) and (B) Control BY-2 cells expressing GFP alone shown as a bright-field image (A) and a fluorescent image (B). (C) and (D) BY-2 cells expressing the GFP–CalS1 fusion protein shown as a bright-field image (C) and a fluorescent image (D). (E) and (F) Callose deposition in the cell plate of control (E) and transgenic cells overexpressing GFP–CalS1 (F). The cells stained with aniline blue and 4′,6-diamidino-2-phenylindole were photographed with a fluorescence microscope with a UV filter set. Arrows in (A) to (F) indicate the cell plate.
Figure 5.
Figure 5.
Copurification of GFP–CalS1 with the CalS Complex and Increase in CalS Activity in Transgenic Cell Lines Expressing CalS1. (A) Protein gel blot analysis of the presence of GFP–CalS1 in membrane fractions of transgenic BY-2 cells. Lane 1, total membranes isolated from tobacco BY-2 cells expressing the GFP–CalS1 chimeric protein; lane 2, Chaps-soluble fraction of the membranes; lane 3, product-entrapped fraction; lane 4, total membranes from control BY-2 cells. Proteins resolved by SDS-PAGE were transferred to a nitrocellulose filter and probed with a monoclonal antibody against GFP. The largest prestained molecular mass marker (103 kD; Bio-Rad) is indicated. (B) Total membranes were isolated from tobacco BY-2 cells synchronized at the cytokinesis stage and extracted with a buffer containing 0.5% digitonin. CalS activity was assayed in the soluble fraction and expressed in fluorescence units per milligram per minute of protein (FU mg−1 min−1). CTL, control BY-2 cells; CSX, transgenic line (CalSX) expressing a deletion variant of CalS1 (only the first half of the molecule) fused with GFP (transgenic GFP- expressing control); CS1-1, 35S::GFP–CalS1 transgenic line 1; CS1-2, 35S::GFP–CalS1 transgenic line 2. Error bars indicate ±sd.
Figure 6.
Figure 6.
Protein–Protein Interaction of CalS1 with Phragmoplastin and UGT1 in a Yeast Two-Hybrid System. (A) X-Gal assay of yeast two-hybrid cells. EGY48 cells containing pSH18-34 and pJG-CalS1 were transformed with vector pEG202 (lane 1, CalS/Vec), pEG-Phr (lane 2, CalS/Phr), or pEG-UGT1 (lane 3, CalS/UGT). The cells were grown on YNB medium containing X-Gal in the presence of glucose (Glu, top) or galactose (Gal, bottom). Note that the interaction occurred only when the expression of phragmoplastin (Phr) or UGT1 (UGT) was induced by galactose. (B) Protein gel blots of proteins from yeast two-hybrid cells. Protein extracts of cells grown in the presence of galactose ([A], bottom) were resolved by SDS-PAGE, and the membrane was incubated with HA antibody that detects the chimeric protein of HA-tagged CalS1 (top). The same membrane was stripped and incubated with phragmoplastin (middle) or UGT1 antibody (bottom). Arrows indicate CalS1 (CalS), phragmoplastin (Phr), and UGT1 (UGT). Sizes (in kilodaltons) of prestained protein markers (M) from Bio-Rad are indicated.

Similar articles

Cited by

References

    1. Amor, Y., Haigler, C.H., Johnson, S., Wainscott, M., and Delmer, D.P. (1995). A membrane-associated form of sucrose synthase and its potential role in synthesis of cellulose and callose in plants. Proc. Natl. Acad. Sci. USA 92, 9353–9357. - PMC - PubMed
    1. Arioli, T., et al. (1998). Molecular analysis of cellulose biosynthesis in Arabidopsis. Science 279, 717–720. - PubMed
    1. Aspinall, G.O., and Kessler, G. (1957). The structure of callose from the grape vine. Chem. Ind. (London), p. 1296.
    1. Brown, R.M., Jr., Saxena, I.M., and Kudlicka, K. (1996). Cellulose biosynthesis in higher plants. Trends Plant Sci. 1, 149–156.
    1. Burge, C., and Karlin, S. (1997). Prediction of complete gene structures in human genomic DNA. J. Mol. Biol. 268, 78–94. - PubMed

Publication types

MeSH terms