. 2001 Apr;13(4):793-806.
doi: 10.1105/tpc.13.4.793.

DNA microarray analysis of cyanobacterial gene expression during acclimation to high light

Affiliations

DNA microarray analysis of cyanobacterial gene expression during acclimation to high light

Y Hihara et al. Plant Cell. 2001 Apr.

Abstract

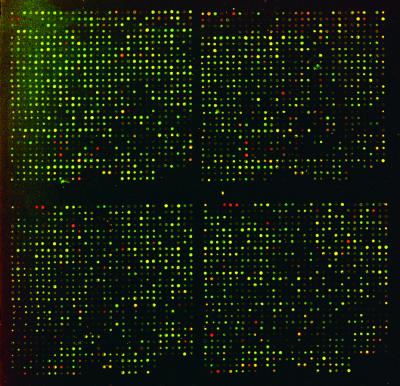
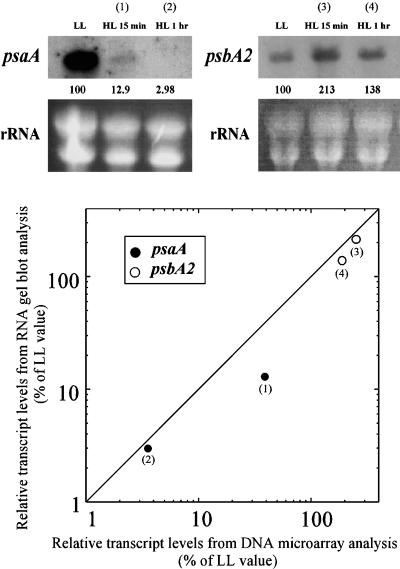
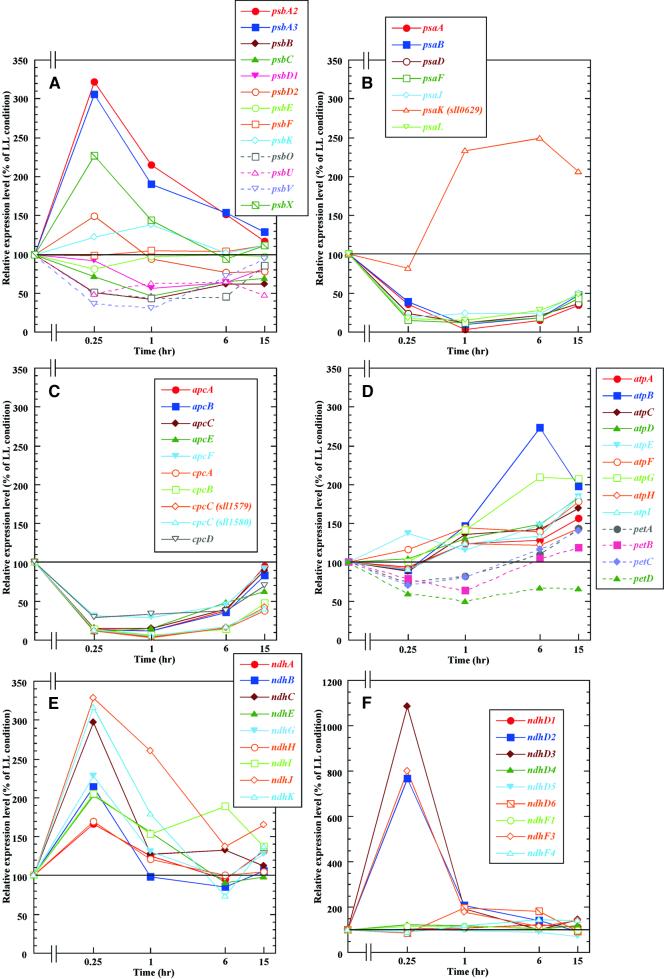
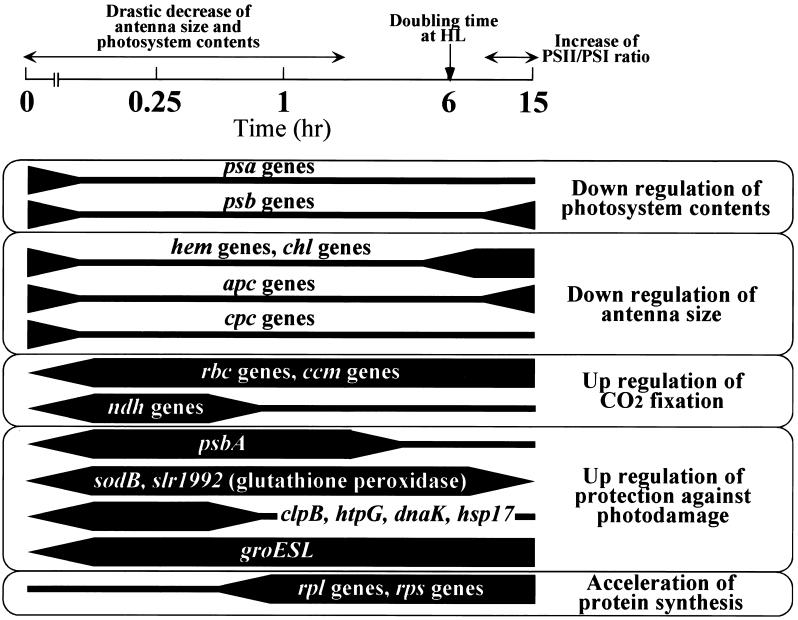
DNA microarrays bearing nearly all of the genes of the unicellular cyanobacterium Synechocystis sp PCC 6803 were used to examine the temporal program of gene expression during acclimation from low to high light intensity. A complete pattern is provided of gene expression during acclimation of a photosynthetic organism to changing light intensity. More than 160 responsive genes were identified and classified into distinct sets. Genes involved in light absorption and photochemical reactions were downregulated within 15 min of exposure to high light intensity, whereas those associated with CO(2) fixation and protection from photoinhibition were upregulated. Changes in the expression of genes involved in replication, transcription, and translation, which were induced to support cellular proliferation, occurred later. Several unidentified open reading frames were induced or repressed. The possible involvement of these genes in the acclimation to high light conditions is discussed.


Figures

Figure 1.
Figure 1.
Two-Color Overlaid Fluorescent Image of a DNA Microarray of HL-Induced and HL-Repressed Genes in Synechocystis sp PCC 6803. Two hybridization data sets from the same microarray were converted into pseudocolor images and superimposed to visualize differential gene expression between LL (Cy3, red) and HL of 6 hr (Cy5, green). ORFs unaffected by the HL shift appear as yellow spots. The upper part of the microarray is shown.
Figure 2.
Figure 2.
Comparison of the Results Obtained by DNA Microarray Analysis and RNA Gel Blot Analysis. The top panel shows the RNA gel blot analysis of psaA and psbA2 transcripts under LL and HL conditions. Values below the blots show the relative levels of transcripts expressed as a percentage of values under LL conditions. The profile of rRNAs stained with ethidium bromide is shown as a control for equal RNA loading. The bottom panel shows the correlation between the relative transcript levels obtained by DNA microarray analysis and RNA gel blot analysis. The same RNA sample was used for the DNA microarray analysis and the RNA gel blot analysis.
Figure 3.
Figure 3.
Accumulation Profile of Transcripts for Protein Complexes in Thylakoid Membranes upon the Shift to HL. The transcript abundance as affected by time after transfer of Synechocystis sp PCC 6803 from LL to HL. Transcript levels for subunits of PSII (A), subunits of PSI (B), phycobiliproteins (C), subunits of ATP synthase and the cytochrome b6/f complex (D), subunits of NADPH dehydrogenase in which genes exist as a single copy in the genome (E), and subunits of NADPH dehydrogenase that are encoded by multiple genes (F) are shown. Each time point is shown logarithmically on the horizontal axis. Accumulation levels of transcripts are expressed on the vertical axis as a percentage of values under LL conditions. Values at 15 min and 1 hr are averages of duplicate results for three independent experiments (six data points in total), and values at 6 and 15 hr are averages of duplicate results for two experiments (four data points in total). The weakly expressed genes encoding thylakoid proteins are omitted from the figures. Identification numbers of the depicted genes are as follows: psbA2, slr1311; psbA3, sll1867; psbB, slr0906; psbC, sll0851; psbD1, sll0849; psbD2, slr0927; psbE, ssr3451; psbF, smr0006; psbK, sml0005; psbO, sll0427; psbU, sll1194; psbV, sll0258; psbX, sml0002; psaA, slr1834; psaB, slr1835; psaD, slr0737; psaF, sll0819; psaJ, sml0008; psaK, sll0629; psaL, slr1655; apcA, slr2067; apcB, slr1986; apcC, ssr3383; apcE, slr0335; apcF, slr1459; cpcA, sll1578; cpcB, sll1577; cpcC, sll1579 and sll1580; cpcD, ssl3093; atpA, sll1326; atpB, slr1329; atpC, sll1327; atpD, sll1325; atpE, slr1330; atpF, sll1324; atpG, sll1323; atpH, ssl2615; atpI, sll1322; ndhA, sll0519; ndhB, sll0223; ndhC, slr1279; ndhE, sll0522; ndhG, sll0521; ndhH, slr0261; ndhI, sll0520; ndhJ, slr1281; ndhK, slr1280; ndhD1, slr0331; ndhD2, slr1291; ndhD3, sll1733; ndhD4, sll0027; ndhD5, slr2007; ndhD6, slr2009; ndhF1, slr0844; ndhF3, sll1732; and ndhF4, sll0026.
Figure 4.
Figure 4.
A Scheme Representing the Relationship between Changes of Transcript Levels and Acclimation to HL. The physiological changes of cells during acclimation to HL (300 μmol photons m−2 sec−1) are shown above the time scale expressed logarithmically. Changes of transcript levels shown by DNA microarray analyses are indicated below the time scale. The thickness of lines roughly represents the amount of transcripts.

References

    1. Anandan, S., and Golden, S.S. (1997). cis-acting sequences required for light-responsive expression of the psbDII gene in Synechococcus sp. strain PCC 7942. J. Bacteriol. 179, 6865–6870. - PMC - PubMed
    1. Anderson, J.M. (1986). Photoregulation of the composition, function, and structure of thylakoid membranes. Annu. Rev. Plant Physiol. 37, 93–136.
    1. Anderson, J.M., Chow, W.S., and Park, Y.-I. (1995). The grand design of photosynthesis: Acclimation of the photosynthetic apparatus to environmental cues. Photosynth. Res. 46, 129–139. - PubMed
    1. Anderson, J.M., Park, Y.-I., and Chow, W.S. (1997). Photoinactivation and photoprotection of photosystem II in nature. Physiol. Plant. 100, 214–223.
    1. Appel, J., and Schulz, R. (1996). Sequence analysis of an operon of a NAD(P)-reducing nickel hydrogenase from the cyanobacterium Synechocystis sp. PCC 6803 gives additional evidence for direct coupling of the enzyme to NAD(P)H-dehydrogenase (complex I). Biochim. Biophys. Acta 1298, 141–147. - PubMed

Publication types

LinkOut - more resources