. 2001 Apr;13(4):807-27.

A katanin-like protein regulates normal cell wall biosynthesis and cell elongation

Affiliations

A katanin-like protein regulates normal cell wall biosynthesis and cell elongation

D H Burk et al. Plant Cell. 2001 Apr.

Abstract

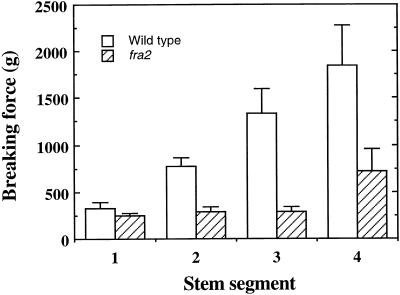
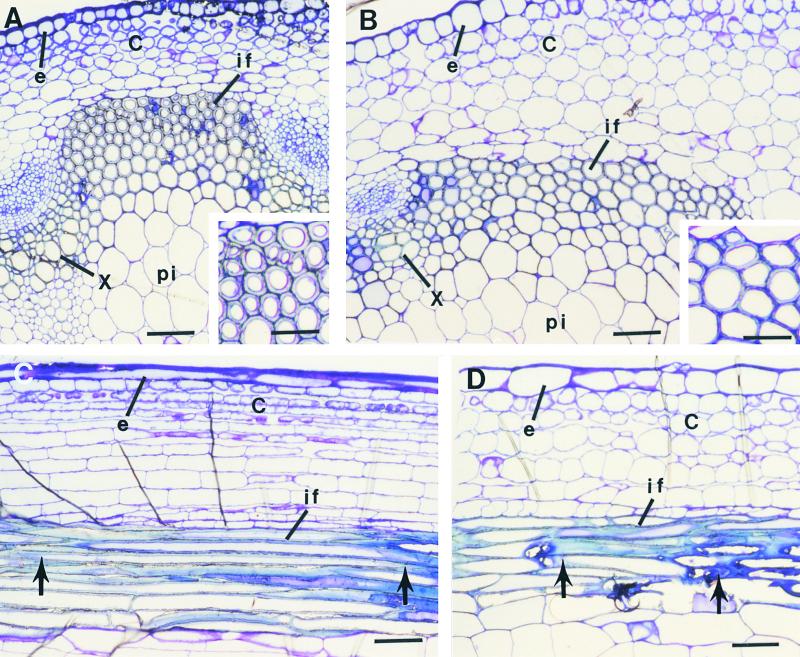
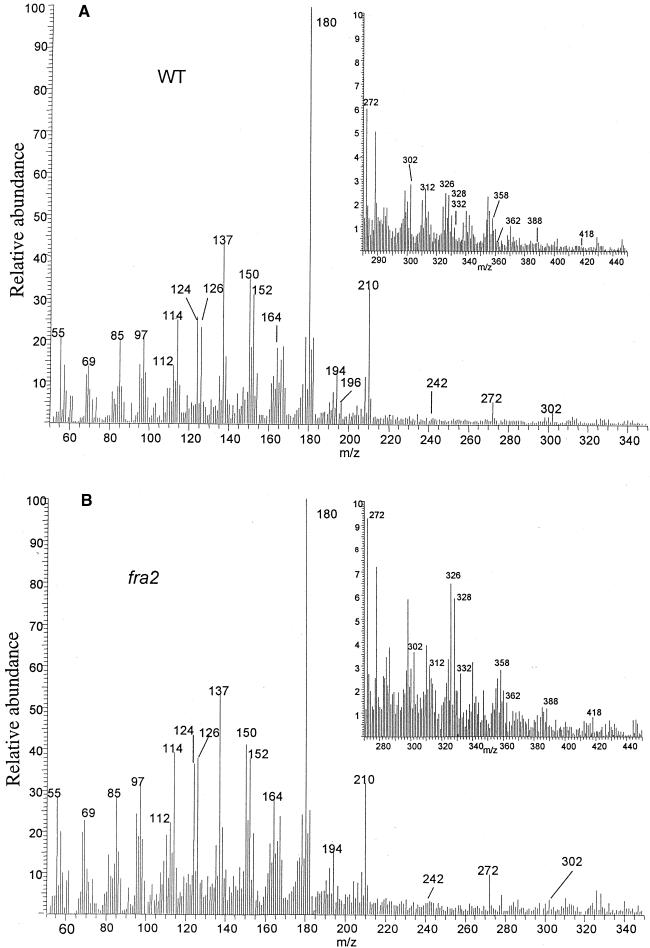
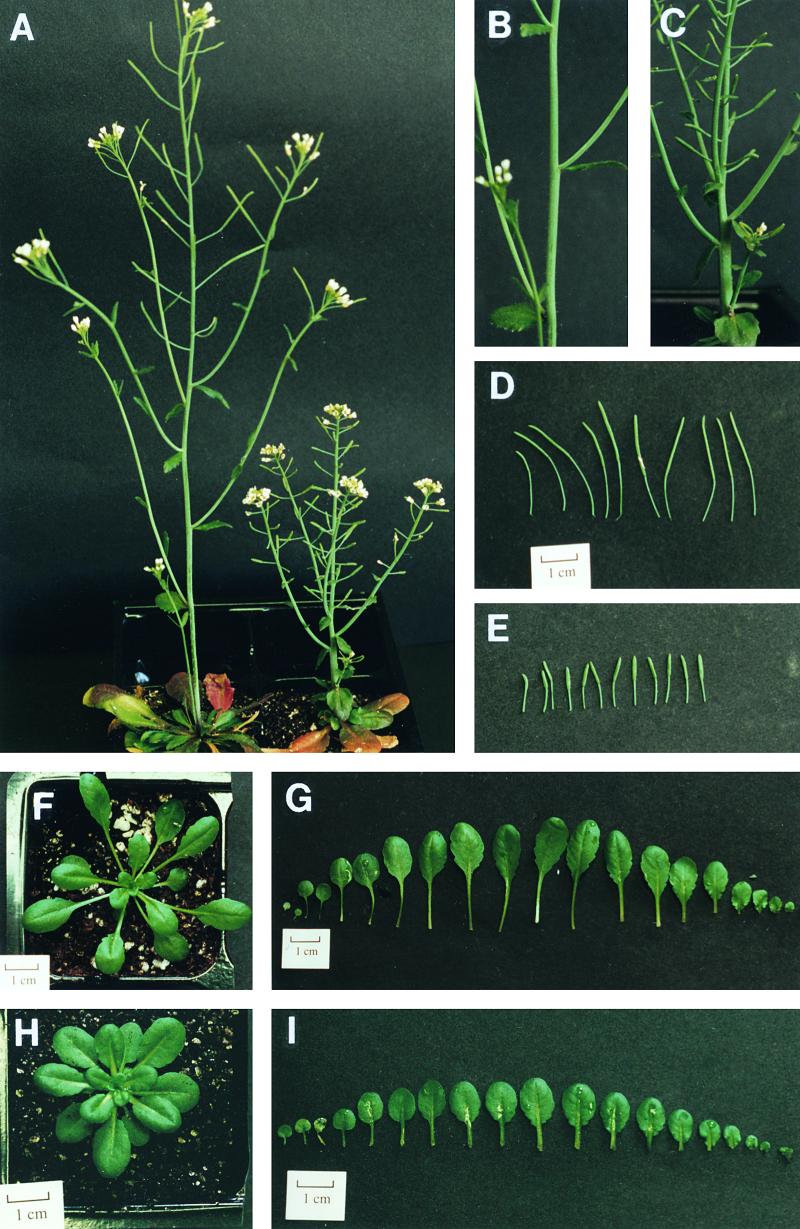
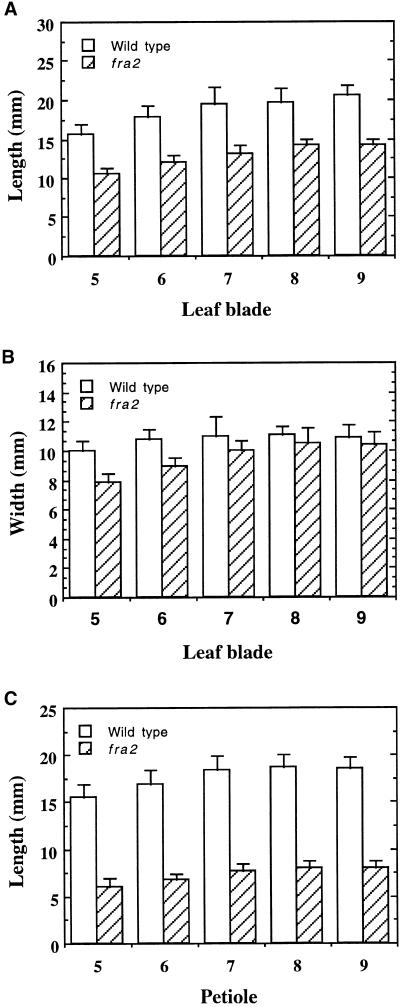
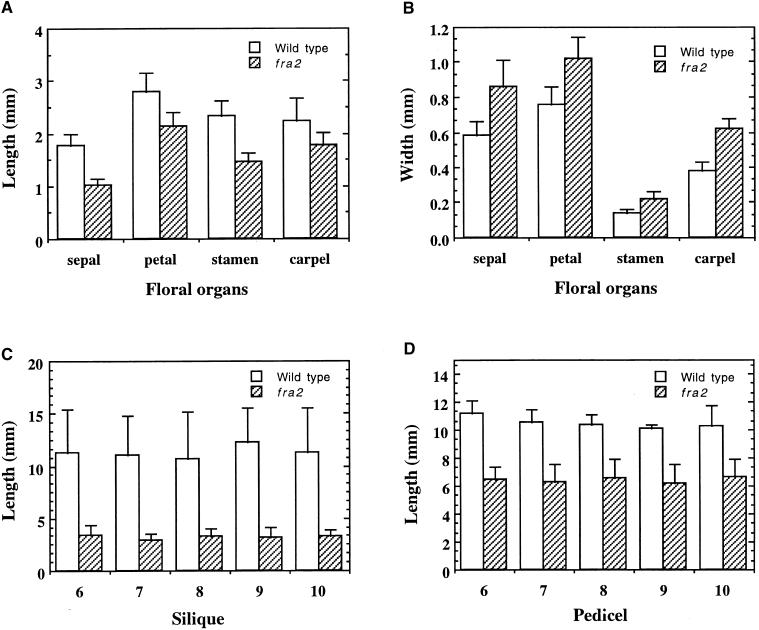
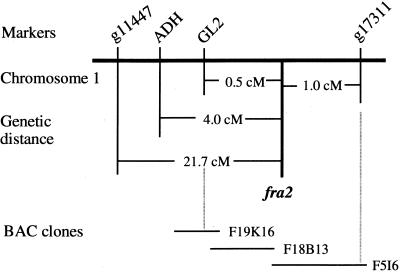
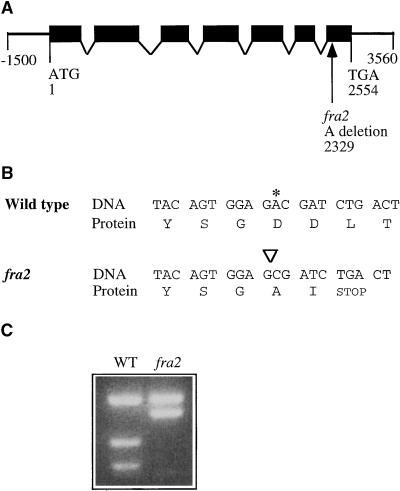
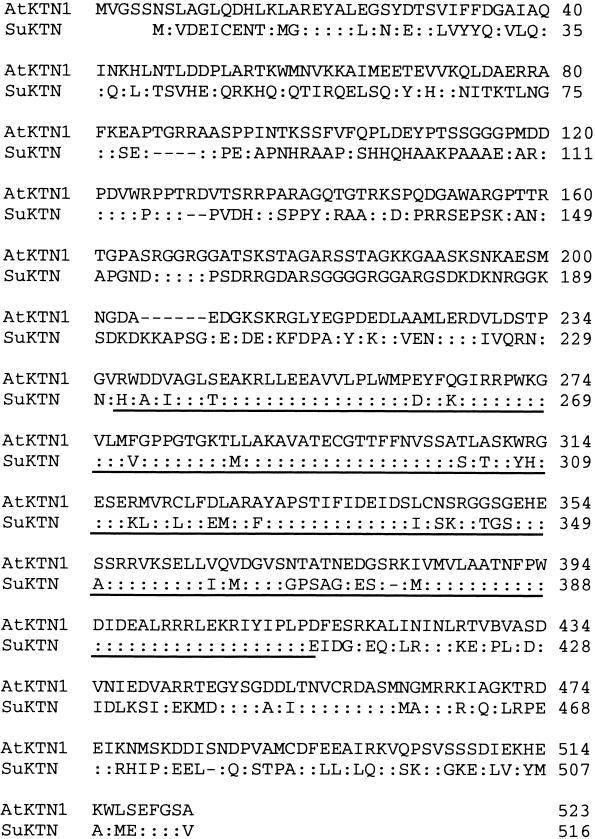
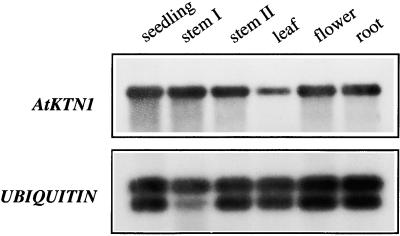
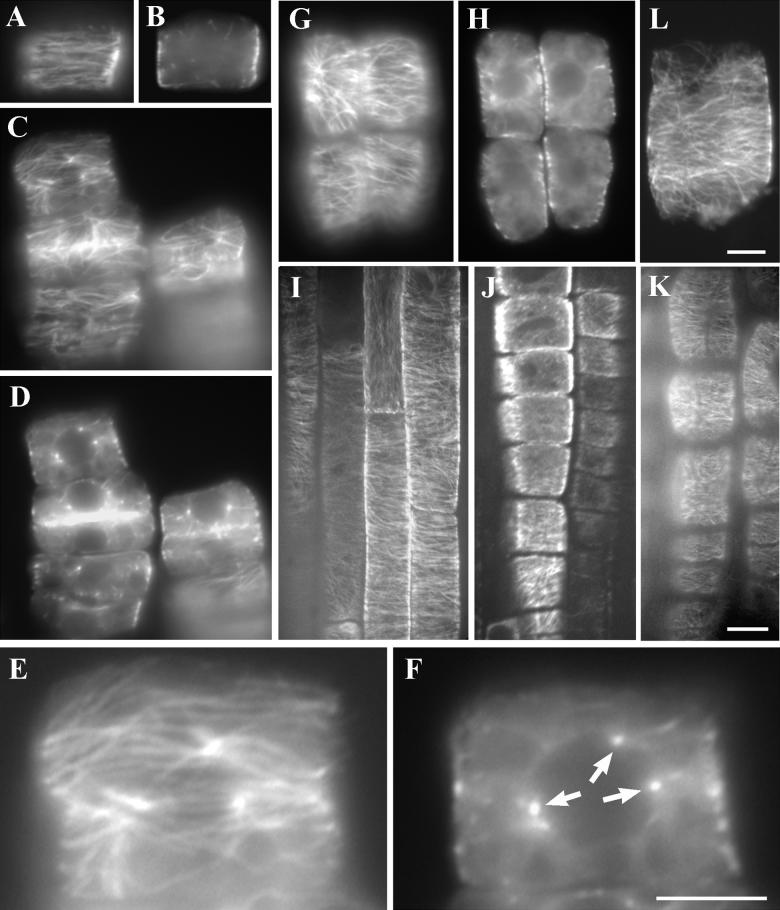
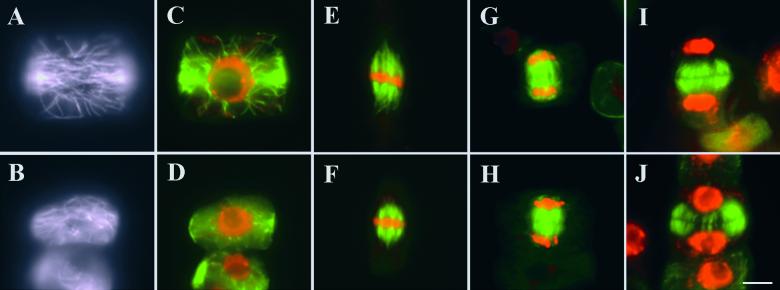
Fibers are one of the mechanical tissues that provide structural support to the plant body. To understand how the normal mechanical strength of fibers is regulated, we isolated an Arabidopsis fragile fiber (fra2) mutant defective in the mechanical strength of interfascicular fibers in the inflorescence stems. Anatomical and chemical analyses showed that the fra2 mutation caused a reduction in fiber cell length and wall thickness, a decrease in cellulose and hemicellulose contents, and an increase in lignin condensation, indicating that the fragile fiber phenotype of fra2 is a result of alterations in fiber cell elongation and cell wall biosynthesis. In addition to the effects on fibers, the fra2 mutation resulted in a remarkable reduction in cell length and an increase in cell width in all organs, which led to a global alteration in plant morphology. The FRA2 gene was shown to encode a protein with high similarity to katanin (hence FRA2 was renamed AtKTN1), a protein shown to be involved in regulating microtubule disassembly by severing microtubules. Consistent with the putative function of AtKTN1 as a microtubule-severing protein, immunolocalization demonstrated that the fra2 mutation caused delays in the disappearance of perinuclear microtubule array and in the establishment of transverse cortical microtubule array in interphase and elongating cells. Together, these results suggest that AtKTN1, a katanin-like protein, is essential not only for normal cell wall biosynthesis and cell elongation in fiber cells but also for cell expansion in all organs.


Figures

Figure 1.
Figure 1.
Breaking Force Measurement in Stems of the Wild Type and the fra2 Mutant. The main inflorescence stems of 8-week-old plants were divided into four equal segments and measured for the force required to break the stems. Segments were numbered in order from the top to the bottom of the stems. Data are mean values ±se for 15 plants.
Figure 2.
Figure 2.
Anatomy of Interfascicular Fibers in Stems of the Wild Type and the fra2 Mutant. (A) and (B) Cross-sections of the stems of the wild type (A) and fra2 (B) showing the presence of interfascicular fibers. Insets show enlarged fiber cells. It is evident that the fiber cell wall in the wild type (A) is much thicker than that in fra2 (B). (C) and (D) Longitudinal sections of the stems of the wild type (C) and fra2 (D). Fiber cells in fra2 (D) are much shorter and wider than those in the wild type (C). Arrows mark the ends of a fiber cell. C, cortex; e, epidermis; if, interfascicular fiber; pi, pith; x, xylem. Bars in (A) to (D) = 55 μm; bars in insets in (A) and (B) = 28 μm.
Figure 3.
Figure 3.
In-Source Pyrolysis Mass Spectrometry of Cell Walls. (A) and (B) Mass spectra of cell walls of the wild type (WT) (A) and the fra2 mutant (B). Mass peaks of guaiacyl lignin had mass–charge ratio (m/z) values of 124, 137, 138, 150, 152, 164, 166, 178, and 180. Mass peaks of syringyl lignin had m/z values of 154, 167, 168, 180, 182, 194, 196, 208, and 210. Mass peaks of cellulose and amylose had m/z values of 57, 60, 73, 85, 86, 96, 98, 100, 102, 110, 112, 126, and 144. Mass peaks of hemicellulose had m/z values of 58, 85, 86, and 114. Insets show the expanded portions of the spectra of mass markers for dimeric lignin, with m/z values of 272, 302, 312, 320, 326, 328, 332, 358, 388, and 418. The relative intensities of mass peaks for cell wall polysaccharides and lignin were altered significantly between the wild type and the fra2 mutant.
Figure 4.
Figure 4.
Morphology of the Wild Type and the fra2 Mutant. (A) Morphology of 8-week-old plants. The main inflorescence stem of a fra2 plant (right) is much shorter than that of a wild-type plant (left). (B) and (C) The main inflorescence stems. The fra2 stem (C) has reduced internode length compared with the wild-type stem (B). (D) and (E) Siliques of wild type (D) and fra2 (E). (F) and (H) The rosette leaves of a 5-week-old fra2 plant (H) are more compact than those of a wild-type plant (F). (G) and (I) Individual leaves of 5-week-old plants. The lengths of both blades and petioles in fra2 (I) are reduced compared with those of the wild type (G). From left to right, the leaves are arranged according to the order from cotyledons to the youngest leaves.
Figure 5.
Figure 5.
Measurement of the Length and Width of Leaves. The fifth to ninth leaves of 5-week-old plants were measured for their length and width. Data are means ±se of 10 leaves. (A) Length of leaf blades, showing a reduction in fra2 compared with the wild type. (B) Width of leaf blades, showing little change in fra2 compared with the wild type. (C) Length of petioles, showing a dramatic reduction in fra2 compared with the wild type.
Figure 6.
Figure 6.
Measurement of the Length and Width of Floral Organs. The sixth to tenth siliques of 8-week-old plants were measured for their length and width. Data are means ±se of 30 samples. (A) and (B) Length and width of floral organs, showing reduced length (A) but increased width (B) in fra2 compared with the wild type. (C) and (D) Length of silique and pedicel, showing a reduction in fra2 compared with the wild type.
Figure 7.
Figure 7.
Scanning Electron Micrographs of Epidermal Cell Morphology. (A) and (D) Five-day-old seedlings showing that fra2 (D) has shorter hypocotyl and root than does the wild type (A). (B) and (E) Roots of 5-day-old seedlings showing that root hair cells in fra2 (E) are more compact than are those in the wild type (B). (C) and (F) Hypocotyls of 5-day-old seedlings showing that epidermal cells in fra2 (F) have reduced length compared with those in the wild type (C). (G) and (J) Trichomes showing that the wild type (G) has two branch points and fra2 (J) has one branch point. (H) and (K) Upper epidermal cells of leaves showing that fra2 (K) has less convolution than does the wild type (H). (I) and (L) Epidermal cells of carpels showing that fra2 (L) has reduced length compared with that of the wild type (I). formula image; formula image; formula image.
Figure 8.
Figure 8.
Cellular Morphology in Different Organs of the Wild Type and the fra2 Mutant. (A) and (B) Longitudinal sections of stems. fra2 (B) has shorter epidermal and cortical cells and altered shape of tracheary elements compared with those of the wild type (A). C, cortex; e, epidermis; ph, phloem; te, tracheary element. (C) and (D) Longitudinal sections of pith showing reduced cell length and less organized cell files in fra2 (D) compared with those in the wild type (C). (E) and (F) Cross-sections of leaves showing enlarged spongy mesophyll cells (sm) in fra2 (F) compared with those in the wild type (E). The arrow points to a giant epidermal cell in fra2 (F). pp, palisade parenchyma. (G) and (H) Longitudinal sections of hypocotyls. Cortical cells in fra2 (H) have reduced length compared with those in the wild type (G). (I) and (J) Longitudinal sections of petioles showing reduced cell length and less organized cell files in fra2 (J) compared with those in the wild type (I). formula image; formula image; formula image.
Figure 9.
Figure 9.
Fine Mapping of the fra2 Locus. F2 mutant plants segregating from the cross of fra2 and Landsberg erecta were used for mapping with CAPS markers. The fra2 locus was mapped to a 230-kb region located between GL2 and g17311, which was covered by three overlapping BAC clones. Markers are not positioned on the scale.
Figure 10.
Figure 10.
Structure of the FRA2 Gene and the Nature of the fra2 Mutation. (A) Exon and intron organization of the FRA2 gene. The FRA2 gene has 2554 nucleotides from the start codon (designated nucleotide 1) to the stop codon (designated nucleotide 2554). A single nucleotide deletion was found at nucleotide 2329 in fra2. Black boxes indicate exons, and lines between boxes indicate introns. (B) Effect of the deletion mutation in fra2 on the translation of the predicted protein. Shown are nucleotide sequences and their amino acid sequences around the deletion site. Deletion of the nucleotide A (marked with an asterisk in the wild type and with an inverted triangle in fra2) leads to a frameshift of codons, thereby generating a premature stop codon at the second codon after the mutation site. (C) Elimination of a BsmAI site in the mutant fra2 cDNA. The deletion mutation in fra2 happens to occur at a BsmAI site. This is readily revealed by digesting polymerase chain reaction (PCR)–amplified cDNA fragments with BsmAI, which shows that one BsmAI site is missing in fra2 cDNA compared with the wild-type (WT) FRA2 cDNA.
Figure 11.
Figure 11.
Alignment of the Deduced Amino Acid Sequences of AtKTN1 and Katanin (SuKTN) from Sea Urchin. AtKTN1 exhibits 56% sequence similarity in the entire open reading frame with katanin from sea urchin. The ATP binding module, which shares 75% sequence similarity between AtKTN1 and katanin, is underlined. The GenBank accession number for the AtKTN1 cDNA sequence data is AF358779.
Figure 12.
Figure 12.
Analysis of AtKTN1 Gene Expression in Arabidopsis Organs. Total RNA was isolated from different organs of Arabidopsis plants and used for reverse transcription–PCR. The ubiquitin gene was used as an internal control for PCR. The seedlings were 3 weeks old. Leaves, roots, and flowers came from 8-week old plants. Stems I and II were from 4- and 8-week-old plants, respectively.
Figure 13.
Figure 13.
Immunostaining of Microtubules in Root Cells of the Wild Type and fra2. Young roots from 5-day-old seedlings were treated with cell wall–digesting enzymes, probed with the antibodies against α-tubulin and fluorescein isothiocyanate–conjugated secondary antibodies, and visualized with an epifluorescence microscope or a confocal microscope. (A) and (B) A surface view (A) of a wild-type interphase cell that has yet to undergo elongation, showing the parallel cortical microtubule network. A midplane view (B) of the same cell, showing no obvious microtubules. (C) and (D) A surface view (C) of the fra2 interphase cells, displaying microtubules in a converged pattern near the cell cortex. A midplane view (D) of the same cells, showing microtubule aggregation points. (E) Close-up of a surface view of the uppermost cell in (C), showing the converging microtubule organization pattern. (F) Close-up of a midplane view of the uppermost cell in (D), showing the microtubule aggregation points (arrows), which are the centers of three microtubule asters facing toward the cell cortex (E). (G) and (H) Surface (G) and midplane (H) views of the fra2 elongating cells, showing the disappearance of microtubule aggregation patterns, except in the top left cell, which retains the microtubule converging pattern. (I) A whole-mount view of the wild-type root, showing cortical microtubules in a transverse pattern in the cell cortex of elongating epidermal cells. (J) and (K) A whole-mount view of the fra2 root, showing cortical microtubules aligned in the cell cortex of elongating epidermal cells. Note that the fra2 epidermal cells are much shorter in length compared with those of the wild type (I). (L) A surface view of a highly vacuolated fra2 cell with well-organized cortical microtubules. formula image; formula image; formula image.
Figure 14.
Figure 14.
Immunostaining of Microtubules in Dividing Root Cells of the Wild Type and fra2. Microtubules were pseudocolored in green, and DNA was pseudocolored in red in (C) to (J). (A) to (D) The microtubules in early broad preprophase bands in a wild-type cell ([A] and [C]) and a fra2 mutant cell ([B] and [D]). (A) and (B) were in the focus at the cell cortex, and (C) and (D) were in the middle. (E) and (F) Metaphase spindles in wild-type (E) and fra2 mutant (F) cells. (G) and (H) Microtubule spindles between two sets of segregated chromatids of a wild-type cell (G) and a fra2 mutant cell (H) during late anaphase. (I) and (J) Typical phragmoplast microtubule arrays in a wild-type cell (I) and a fra2 mutant cell (J). Microtubules have already started to depolymerize in the central region in the phragmoplast shown in (J). formula image.

Similar articles

Cited by

References

    1. Ahmad, F.J., Yu, W., McNally, F.J., and Baas, P.W. (1999). An essential role for katanin in severing microtubules in the neuron. J. Cell Biol. 145, 305–315. - PMC - PubMed
    1. Akin, D.E., Morrison, W.H., and Himmelsbach, D.S. (1993). Characterization of digestion residues of alfalfa and orchardgrass leaves by microscopic, spectroscopic and chemical analysis. J. Sci. Food Agric. 63, 339–347.
    1. Aloni, R. (1987). Differentiation of vascular tissues. Annu. Rev. Plant Physiol. 38, 179–204.
    1. Arioli, T., et al. (1998). Molecular analysis of cellulose biosynthesis in Arabidopsis. Science 279, 717–720. - PubMed
    1. Baskin, T.I. (2000). The cytoskeleton. In Biochemistry and Molecular Biology of Plants, B.B. Buchanan, W. Gruissem, and R.L. Jones, eds (Rockville, MD: American Society of Plant Physiologists), pp. 202–258.

Publication types

MeSH terms

Associated data