. 2001 Apr;13(4):873-87.
doi: 10.1105/tpc.13.4.873.

Identification of two loci in tomato reveals distinct mechanisms for salt tolerance

Affiliations

Identification of two loci in tomato reveals distinct mechanisms for salt tolerance

O Borsani et al. Plant Cell. 2001 Apr.

Abstract

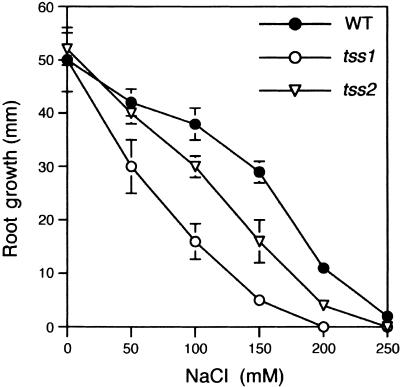
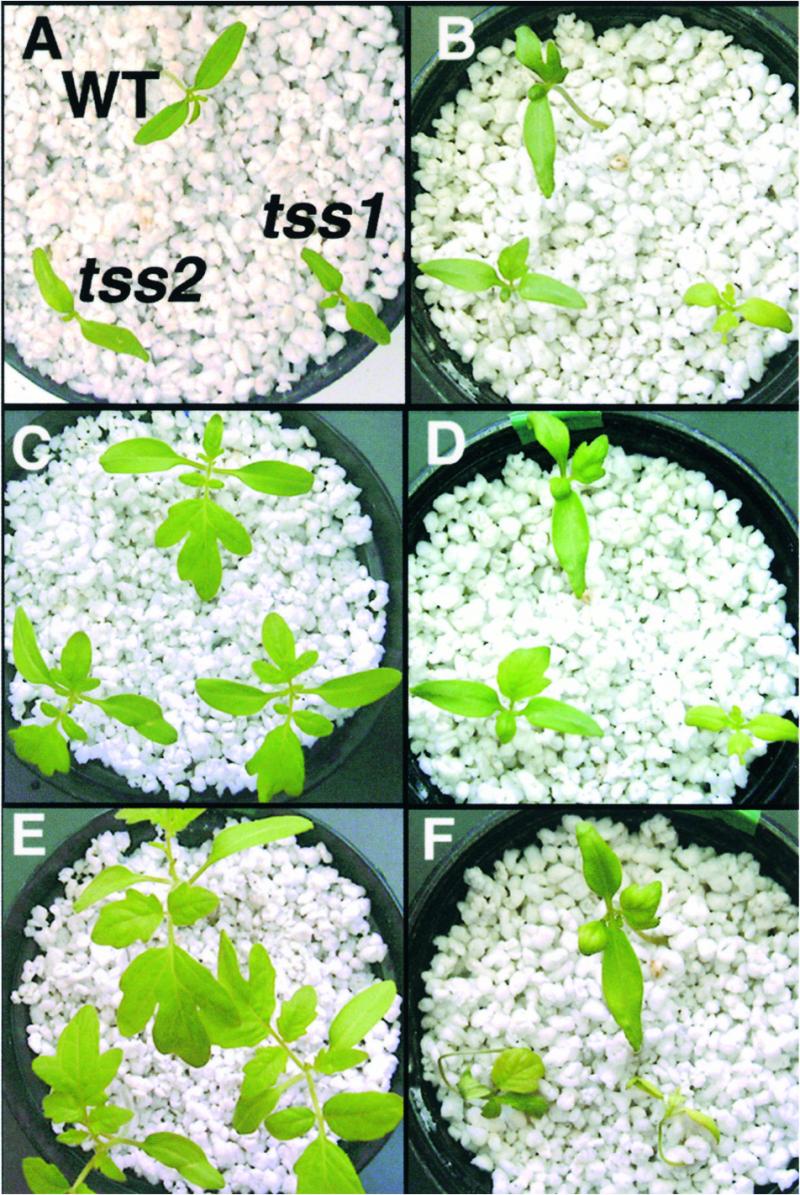
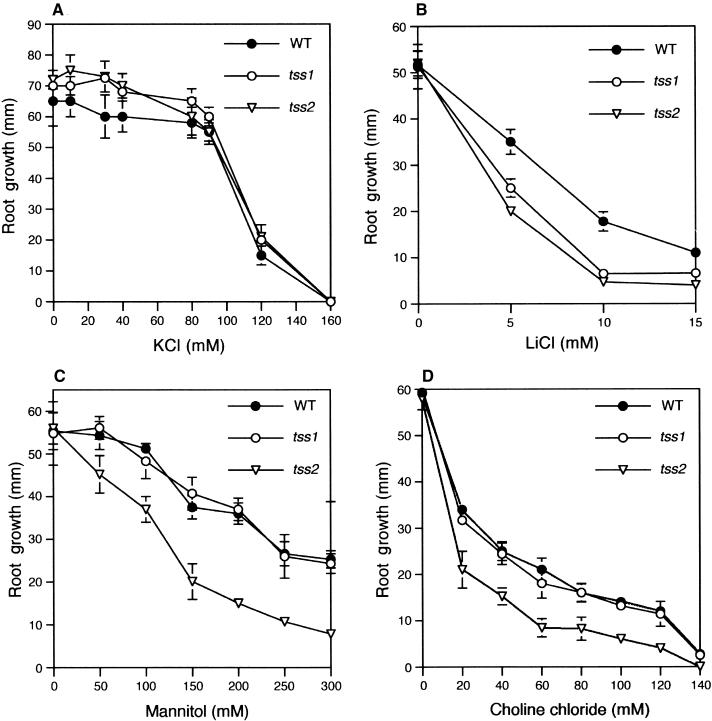
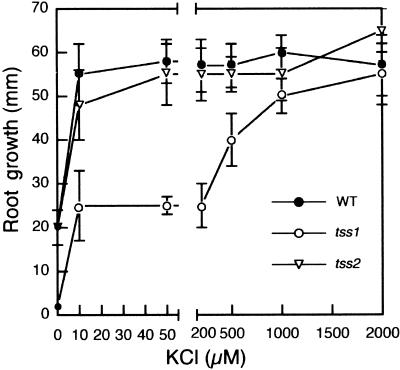
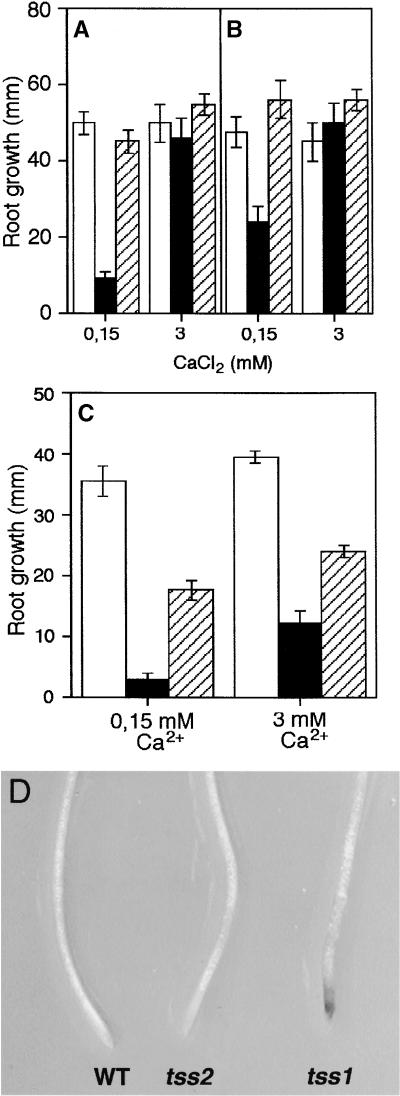
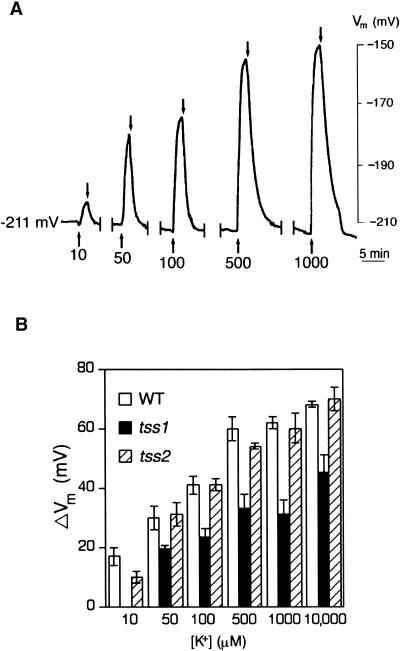
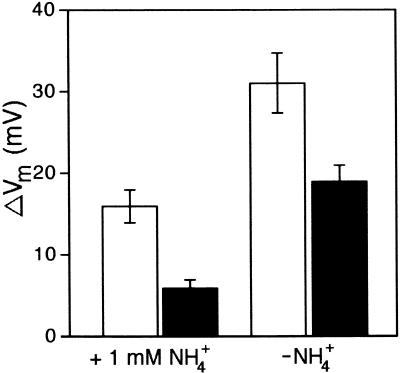
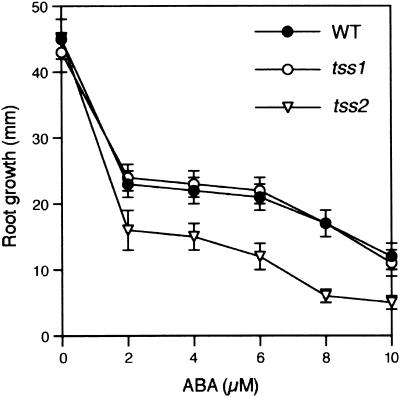
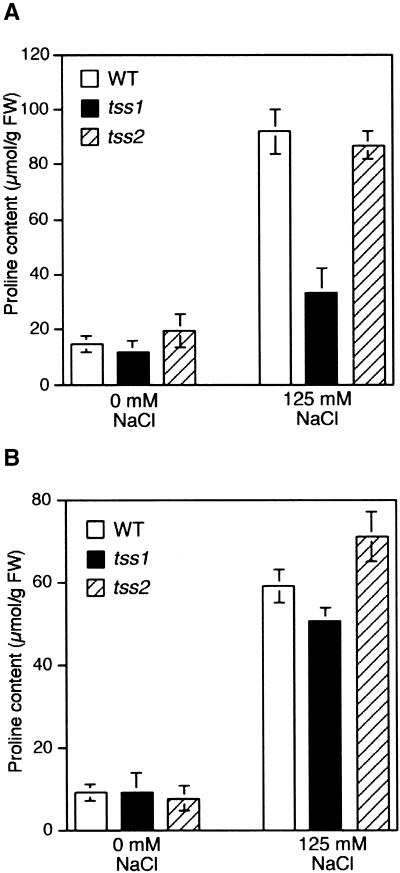
Salt stress is one of the most serious environmental factors limiting the productivity of crop plants. To understand the molecular basis for salt responses, we used mutagenesis to identify plant genes required for salt tolerance in tomato. As a result, three tomato salt-hypersensitive (tss) mutants were isolated. These mutants defined two loci and were caused by single recessive nuclear mutations. The tss1 mutant is specifically hypersensitive to growth inhibition by Na(+) or Li(+) and is not hypersensitive to general osmotic stress. The tss2 mutant is hypersensitive to growth inhibition by Na(+) or Li(+) but, in contrast to tss1, is also hypersensitive to general osmotic stress. The TSS1 locus is necessary for K(+) nutrition because tss1 mutants are unable to grow on a culture medium containing low concentrations of K(+). Increased Ca(2)+ in the culture medium suppresses the growth defect of tss1 on low K(+). Measurements of membrane potential in apical root cells were made with an intracellular microelectrode to assess the permeability of the membrane to K(+) and Na(+). K(+)-dependent membrane potential measurements indicate impaired K(+) uptake in tss1 but not tss2, whereas no differences in Na(+) uptake were found. The TSS2 locus may be a negative regulator of abscisic acid signaling, because tss2 is hypersensitive to growth inhibition by abscisic acid. Our results demonstrate that the TSS1 locus is essential for K(+) nutrition and NaCl tolerance in tomato. Significantly, the isolation of the tss2 mutant demonstrates that abscisic acid signaling is also important for salt and osmotic tolerance in glycophytic plants.


Figures

Figure 1.
Figure 1.
Identification of Tomato Salt-Hypersensitive Mutants. Three-day-old tomato seedlings of the M2 tss1-1 family with 1.5-cm-long roots grown on vertical agar plates on Murashige and Skoog (MS) medium were transferred to MS plates supplemented with 125 mM NaCl and allowed to grow for another 2 days. Arrows indicate those seedlings whose growth was inhibited.
Figure 2.
Figure 2.
tss1 and tss2 Seedlings Are Hypersensitive to NaCl. Root elongation of wild-type (WT), tss1, and tss2 seedlings was measured to quantify their sensitivities to NaCl inhibition. Seed of the wild type, tss1, and tss2 were germinated and grown for 3 days on MS medium. Resulting seedlings were incubated vertically on MS medium supplemented with the indicated concentrations of NaCl, and their growth was measured 2 days later. Error bars represent the standard deviation (formula image). The experiment was repeated at least three times with similar results. The measurements from one representative experiment are presented.
Figure 3.
Figure 3.
NaCl Shoot Hypersensitivity of tss1 and tss2. Three-day-old tomato seedlings with 1.5-cm-long roots grown on vertical agar plates on MS medium were transferred to perlite. After 3 days, seedlings were flooded every day with either half-strength Hoagland nutrient solution or half-strength Hoagland nutrient solution supplemented with 250 mM NaCl. In each photograph, the wild type (WT) is at top, tss1 is at bottom right, and tss2 is at bottom left. (A) Phenotype of plants grown in medium without NaCl stress for 1 day. (B) Phenotype of plants exposed to NaCl stress for 1 day. (C) Phenotype of plants grown in medium without NaCl stress for 7 days. (D) Phenotype after 7 days of NaCl stress. (E) Phenotype of plants grown in medium without NaCl stress for 14 days. (F) Phenotype after 14 days of NaCl stress.
Figure 4.
Figure 4.
Sensitivity of tss1 and tss2 to Ionic and Osmotic Stress. Root elongation of wild-type (WT), tss1, and tss2 seedlings was measured to quantify their sensitivities to KCl, LiCl, mannitol, and choline chloride. Seed of the wild type, tss1, and tss2 were germinated and grown for 3 days on MS medium. Resulting seedlings were incubated vertically on MS medium supplemented with the indicated concentrations of KCl, LiCl, mannitol, or choline chloride, and their growth was measured 2 days later. Error bars represent the standard deviation (formula image). The experiment was repeated at least three times with similar results. The measurements from one representative experiment are presented. (A) Growth response to KCl. (B) Growth response to LiCl. (C) Growth response to mannitol. (D) Growth response to choline chloride.
Figure 5.
Figure 5.
tss1 Mutants but Not tss2 Mutants Are Hypersensitive to Growth on Low Potassium. Seed of the wild type (WT), tss1, and tss2 were germinated and grown for 3 days on modified MS medium containing 5 μM K+. Resulting seedlings were incubated vertically on modified half-strength MS medium containing the indicated concentrations of KCl. Root growth in the first 2 days was not measured so that the effect of residual K+ carried over from the germination medium was minimized. After this time, root elongation was measured 3 days later. Error bars represent the standard deviation (formula image). The experiment was repeated at least three times with similar results. The measurements from one representative experiment are presented.
Figure 6.
Figure 6.
High Ca2+ Suppresses the Growth Defect of tss1 on Low-K+ Medium but Not on High-NaCl Medium. (A) Plants were grown on a modified MS medium containing 50 μM K+ for 2 days and then transferred to a modified MS medium containing 500 μM K+ and either 0.15 or 3 mM Ca2+ as total Ca2+. Their growth was measured 3 days later. Open bars, wild type; closed bars, tss1; striped bars, tss2. Error bars represent the standard deviation (formula image). (B) Plants were grown on MS medium for 2 days and then transferred to modified MS medium containing 500 μM K+ and either 0.15 or 3 mM Ca2+ as total Ca2+. Their growth was measured 3 days later. Open bars, wild type; closed bars, tss1; striped bars, tss2. Error bars represent the standard deviation (formula image). (C) Plants were grown on MS medium for 2 days and then transferred to MS medium containing 125 mM NaCl and either 0.15 or 3 mM Ca2+ as total Ca2+. Their growth was measured 3 days later. Open bars, wild type; closed bars, tss1; striped bars, tss2. Error bars represent the standard deviation (formula image). (D) Low Ca2+ and K+ in the growth medium induces necrosis in the root tip of tss1. Root tips of wild-type (WT), tss1, and tss2 seedlings were photographed after growing for 5 days in 0.15 mM Ca2+ and 100 μM K+.
Figure 7.
Figure 7.
Roots of tss1 Mutants Show Reduced K+ Uptake Compared with Those of the Wild Type and tss2. Changes in Vm of the wild type, tss1, and tss2 resulting from changes in the K+ concentration of the bathing solution are shown. (A) Recording of Vm in a root hair 5 to 10 mm from the root tip of a wild-type tomato. From an initial Vm of −211 mV in this example, the membrane depolarized in response to increasing [K+]ext in the bathing solution. Arrows pointing up correspond to the change of a bathing solution containing the indicated K+ concentration, and arrows pointing down correspond to the change of a bathing solution without K+. This solution was kept for 10 min before the addition of a new bathing solution with K+. (B) Magnitude of the change in steady state Vm in response to changing [K+]ext in the bathing solution without NH4+. Error bars represent the standard deviation of three assays in three independent plants (formula image). WT, wild type.
Figure 8.
Figure 8.
NH4+-Sensitive and NH4+-Insensitive K+ Transport in tss1. Changes in Vm resulting from changing [K+]ext from 0 to 50 μM in wild-type and tss1 roots in the presence and absence of 1 mM NH4+. Open bars, wild type; closed bars, tss1. Error bars represent the standard deviation of three assays in three independent plants (formula image).
Figure 9.
Figure 9.
tss2 Mutants but Not tss1 Mutants Are Hypersensitive to ABA. Root elongation of wild-type (WT), tss1, and tss2 seedlings was measured to quantify their sensitivities to ABA. Seed of the wild type, tss1, and tss2 were germinated and grown for 3 days on ABA-free medium. Resulting seedlings were incubated vertically on medium supplemented with the indicated concentrations of ABA, and their growth was measured 2 days later. Error bars represent the standard deviation (formula image). The experiment was repeated at least three times with similar results. The measurements from one representative experiment are presented.
Figure 10.
Figure 10.
Accumulation of Proline in the Wild Type, tss1, and tss2 in Roots and Shoots after NaCl Stress. Seed of the wild type (WT), tss1, and tss2 were germinated and grown for 3 days on NaCl-free medium. Contents of proline were determined after incubating the seedlings for 3 days on control medium or medium supplemented with 125 mM NaCl. The data presented are averages of the results obtained from three independent experiments. Error bars represent the standard deviation (n = 20). The experiment was repeated twice with similar results. FW, fresh weight. (A) Contents of proline in the root. (B) Contents of proline in the shoot.

References

    1. Ashraf, M. (1994). Breeding for salinity tolerance proteins in plants. Crit. Rev. Plant Sci. 13, 17–42.
    1. Benlloch, M., Ojeda, M.A., Ramos, J., and Rodriguez-Navarro, A. (1994). Salt sensitivity and low discrimination between potassium and sodium in bean plants. Plant Soil 166, 117–123.
    1. Bohnert, H.J., Nelson, D.E., and Jensen, R.G. (1995). Adaptation to environmental stress. Plant Cell 7, 1099–1111. - PMC - PubMed
    1. Borsani, O., Díaz, P., and Monza, J. (1999). Proline is involved in water stress responses of Lotus corniculatus nitrogen fixing and nitrate fed plants. J. Plant Physiol. 155, 269–273.
    1. Botella, M.A., Quesada, M.A., Kononowicz, A., Bressan, R.A., Hasegawa, P.M., and Valpuesta, V. (1994). Characterization and in situ localization of a salt induced tomato peroxidase gene. Plant Mol. Biol. 25, 105–114. - PubMed

Publication types