. 2001 Apr;13(4):889-905.
doi: 10.1105/tpc.13.4.889.

Gene expression profiles during the initial phase of salt stress in rice

Affiliations

Gene expression profiles during the initial phase of salt stress in rice

S Kawasaki et al. Plant Cell. 2001 Apr.

Abstract

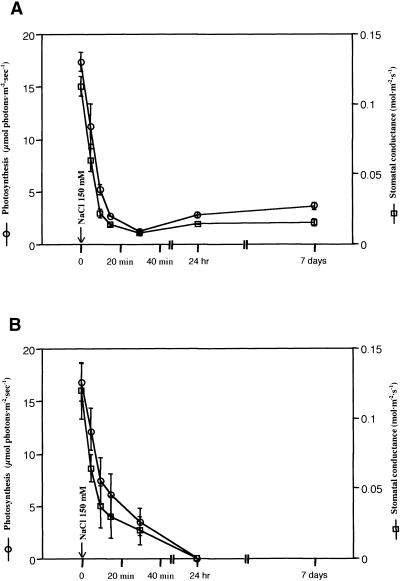
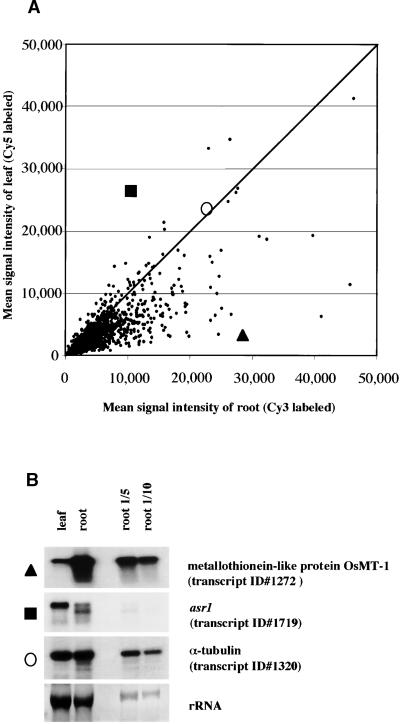
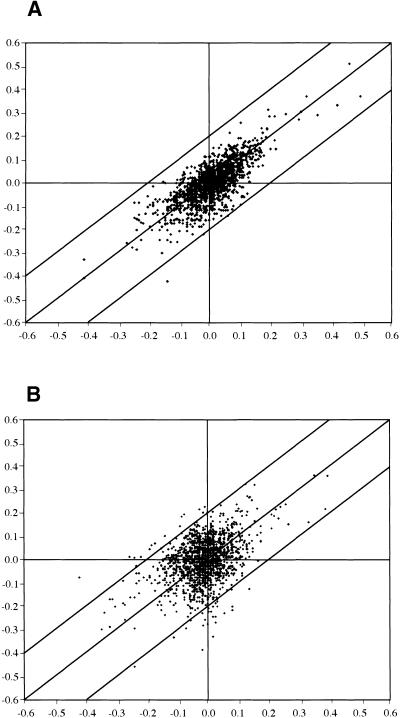
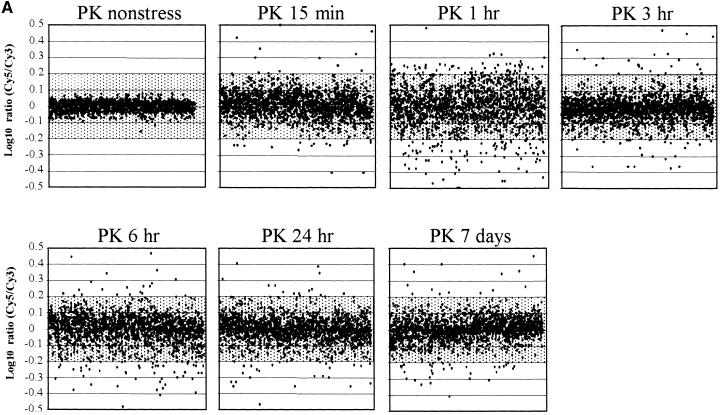
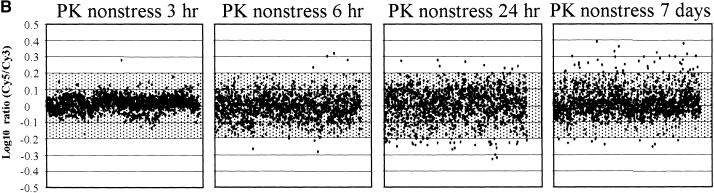
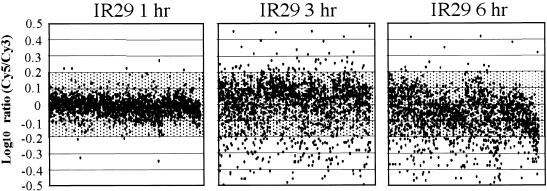
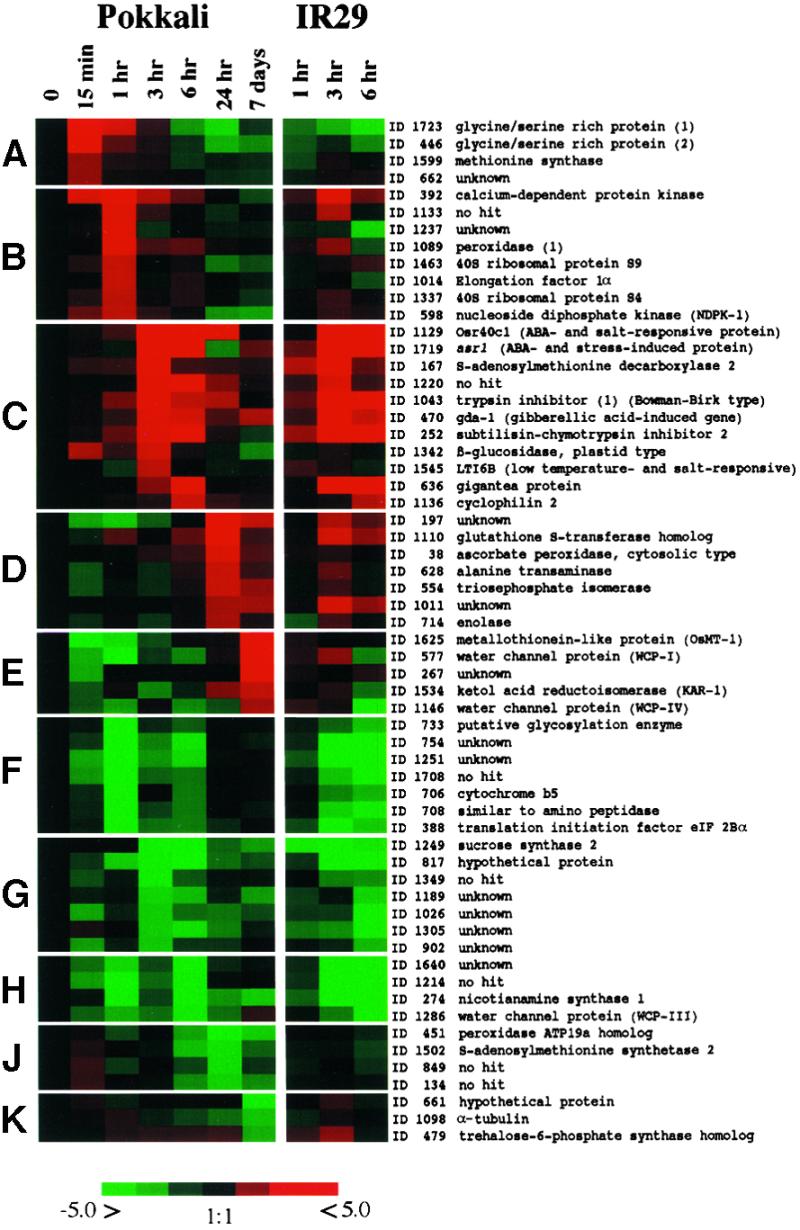
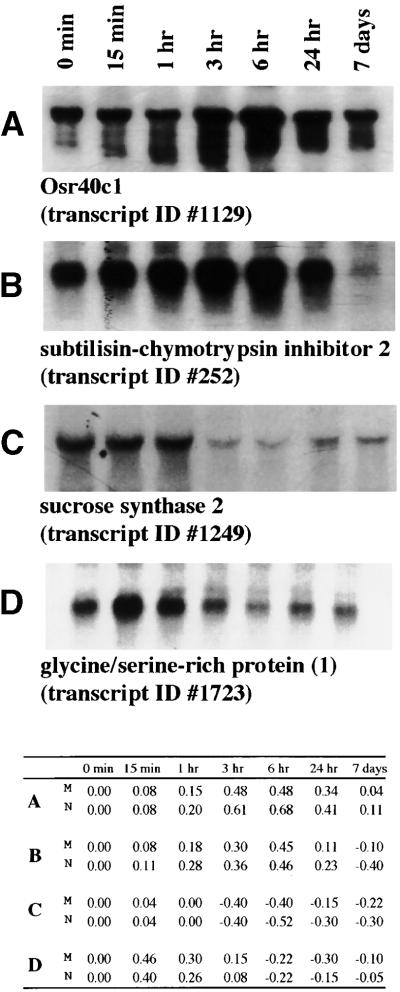
Transcript regulation in response to high salinity was investigated for salt-tolerant rice (var Pokkali) with microarrays including 1728 cDNAs from libraries of salt-stressed roots. NaCl at 150 mM reduced photosynthesis to one tenth of the prestress value within minutes. Hybridizations of RNA to microarray slides probed for changes in transcripts from 15 min to 1 week after salt shock. Beginning 15 min after the shock, Pokkali showed upregulation of transcripts. Approximately 10% of the transcripts in Pokkali were significantly upregulated or downregulated within 1 hr of salt stress. The initial differences between control and stressed plants continued for hours but became less pronounced as the plants adapted over time. The interpretation of an adaptive process was supported by the similar analysis of salinity-sensitive rice (var IR29), in which the immediate response exhibited by Pokkali was delayed and later resulted in downregulation of transcription and death. The upregulated functions observed with Pokkali at different time points during stress adaptation changed over time. Increased protein synthesis and protein turnover were observed at early time points, followed by the induction of known stress-responsive transcripts within hours, and the induction of transcripts for defense-related functions later. After 1 week, the nature of upregulated transcripts (e.g., aquaporins) indicated recovery.


Figures

Figure 1.
Figure 1.
Physiological Responses to High Salinity by Rice (var Pokkali). Net CO2 assimilation and stomatal conductance in Pokkali (A) and IR29 (B) seedlings under salt-stress conditions (150 mM NaCl). Seedlings were grown in Hoagland's nutrient solution and exposed to salt stress (9 am) as indicated by the arrow.
Figure 2.
Figure 2.
Tissue Specificity by Microarray Hybridizations. (A) Scatter plot comparing the spot intensities in hybridizations with probes from nonstressed roots (Cy3 labeled, x axis) and leaves (Cy5 labeled, y axis). Data from images of both Cy3 and Cy5 were plotted as the mean signal intensity after normalization of ESTs spotted in triplicate. The signal intensity of OsMT-1 (transcript 1272, triangle), asr1 (transcript 1719, square), and α-tubulin (transcript 1320, circle) are individually plotted and were confirmed by RNA gel blot analysis. (B) RNA gel blot analysis for selected clones with total RNA (10 μg/lane) from control roots and leaves. RNA gel blot hybridizations were performed under the same condition used for the microarrays. The same membrane with total RNA from leaves and roots was used repeatedly for RNA gel blot hybridizations after washing with boiling water before reprobing. An RNA dilution series is included. Images exposed on x-ray film were analyzed by GelExpert software (version 3.5; Nucleotech, San Carlos, CA). The calculated log-10 ratios for root and leaf signals in RNA gel blot and microarrays are as follows: OsMT-1, 1.10/0.98; asr1, −0.4/−0.4; and α-tubulin, 0.02/−0.01.
Figure 3.
Figure 3.
Comparison of Expression Ratios in Independent Microarray Hybridizations. (A) Technical repetition. Scatter plot comparing the log-10 expression ratios (LR) from independent hybridizations using the same RNA. RNA of Pokkali root tissue from control and 150 mM NaCl- stressed Pokkali were labeled with Cy3 and Cy5, respectively, and the log ratios are compared. The repetition indicated 99% of the ESTs within ±0.2 LR. (B) Scatter plot comparing the LR from independent hybridizations using RNA from different experiments with plants grown at different times under identical conditions in a greenhouse. Root RNA from control and 150 mM NaCl-stressed Pokkali extracted from the different sets of plants were labeled with Cy3 and Cy5 for microarray hybridization, and LRs were compared. This and other repetitions indicated 94 to 97% of the ESTs within ±0.2 LR. In the example, 2.7% of the ratios exceeded 0.2 LR from the mean; in all experiments, persistently variable elements were flagged and removed from the analysis.
Figure 4.
Figure 4.
Time Course of Transcript Expression in Rice (var Pokkali). Transcripts expressed after 150 mM NaCl stress are shown. The expression ratios of transcripts (log-10 Cy5/Cy3) from a series of time course experiments using the microarray for Pokkali (PK) are plotted against the order of ESTs printed on the microarray (x axis). (A) Stress responses during the 7-day period. RNA from control Pokkali roots (harvested at 9 am) labeled with Cy3- and Cy5-labeled RNA extracted from 150 mM NaCl-stressed roots for six time points (15 min, 1 hr, 3 hr, 6 hr, 24 hr, and 7 days) was used in hybridizations to ESTs deposited on microarray slides. (B) Developmental changes during the 7-day period. RNA from control Pokkali roots (harvested at 9 am) labeled with Cy3- and Cy5-labeled RNA extracted from control (no stress) Pokkali roots from four time points (3, 6, and 24 hr and 7 days).
Figure 4.
Figure 4.
Time Course of Transcript Expression in Rice (var Pokkali). Transcripts expressed after 150 mM NaCl stress are shown. The expression ratios of transcripts (log-10 Cy5/Cy3) from a series of time course experiments using the microarray for Pokkali (PK) are plotted against the order of ESTs printed on the microarray (x axis). (A) Stress responses during the 7-day period. RNA from control Pokkali roots (harvested at 9 am) labeled with Cy3- and Cy5-labeled RNA extracted from 150 mM NaCl-stressed roots for six time points (15 min, 1 hr, 3 hr, 6 hr, 24 hr, and 7 days) was used in hybridizations to ESTs deposited on microarray slides. (B) Developmental changes during the 7-day period. RNA from control Pokkali roots (harvested at 9 am) labeled with Cy3- and Cy5-labeled RNA extracted from control (no stress) Pokkali roots from four time points (3, 6, and 24 hr and 7 days).
Figure 5.
Figure 5.
Time Course of Transcript Expression in Rice (var IR29). Transcripts expressed after 150 mM NaCl stress are shown. The expression ratios of transcripts (log-10 Cy5/Cy3) from a series of time course experiments are plotted against the order of ESTs printed on the microarray (x axis). RNA from control IR29 roots (harvested at 9 am) labeled with Cy3- and Cy5-labeled RNA extracted from 150 mM NaCl-stressed IR29 from three time points were hybridized to ESTs deposited on microarray slides.
Figure 6.
Figure 6.
Cluster Analysis of 60 Transcripts in Different Response Categories in Pokkali and IR29 after Salt Stress. Clustering was performed according to Eisen et al. (1998). The color saturation reflects the magnitude of the log-10 expression ratio (Cy5/Cy3) for each transcript with clone number (transcript number) and annotation. Transcripts are grouped into patterns (A) to (K) according to their expression profiles of upregulation or downregulation at different time points. ABA, abscisic acid.
Figure 7.
Figure 7.
RNA Gel Blot Analysis of Selected Transcripts. (Top) Total RNA for control and stressed roots (15 min to 7 days) was used for RNA gel blot analysis (10 μg/lane) for four transcripts: Osr40c1 (transcript 1129 [A]), subtilisin-chymotrypsin inhibitor 2 (transcript 252 [B]), sucrose synthase 2 (transcript 1249 [C]), and glycine-serine–rich protein-1 (transcript 1723 [D]). Signal intensities were analyzed by GelExpert software version 3.5 (Nucleotech). (Bottom) Expression ratios [M, microarray (stressed/nonstressed)/N, RNA gel blot analysis (Cy5, stressed/Cy3, nonstressed] for each clone [A] to [D] for 0 min, 15 min, 1 hr, 3 hr, 6 hr, 24 hr, and 7 days) are listed.

References

    1. Apse, M.P., Aharon, G.S., Snedden, W.A., and Blumwald, E. (1999). Salt tolerance conferred by overexpression of a vacuolar Na+/H+ antiport in Arabidopsis. Science 285, 1256–1258. - PubMed
    1. Barkla, B.J., Vera-Estrella, R., and Pantoja, O. (1999). Towards the production of salt-tolerant crops. Adv. Exp. Med. Biol. 464, 77–89. - PubMed
    1. Basu, S., and Maitra, U. (1988). Salinity results in polyamine accumulation in early rice (Oryza sativa L.) seedlings. Aust. J. Plant Physiol. 15, 777–786.
    1. Berberich, T., and Kusano, T. (1997). Cycloheximide induces a subset of low temperature-inducible genes in maize. Mol. Gen. Genet. 254, 275–283. - PubMed
    1. Boyer, J.S. (1982). Plant productivity and environment. Science 218, 443–448. - PubMed

Publication types

Substances

LinkOut - more resources