Comparative Study
. 2001 Apr;45(4):673-83.
doi: 10.1002/mrm.1090.

Planar strip array (PSA) for MRI

Affiliations
Comparative Study

Planar strip array (PSA) for MRI

R F Lee et al. Magn Reson Med. 2001 Apr.

Abstract

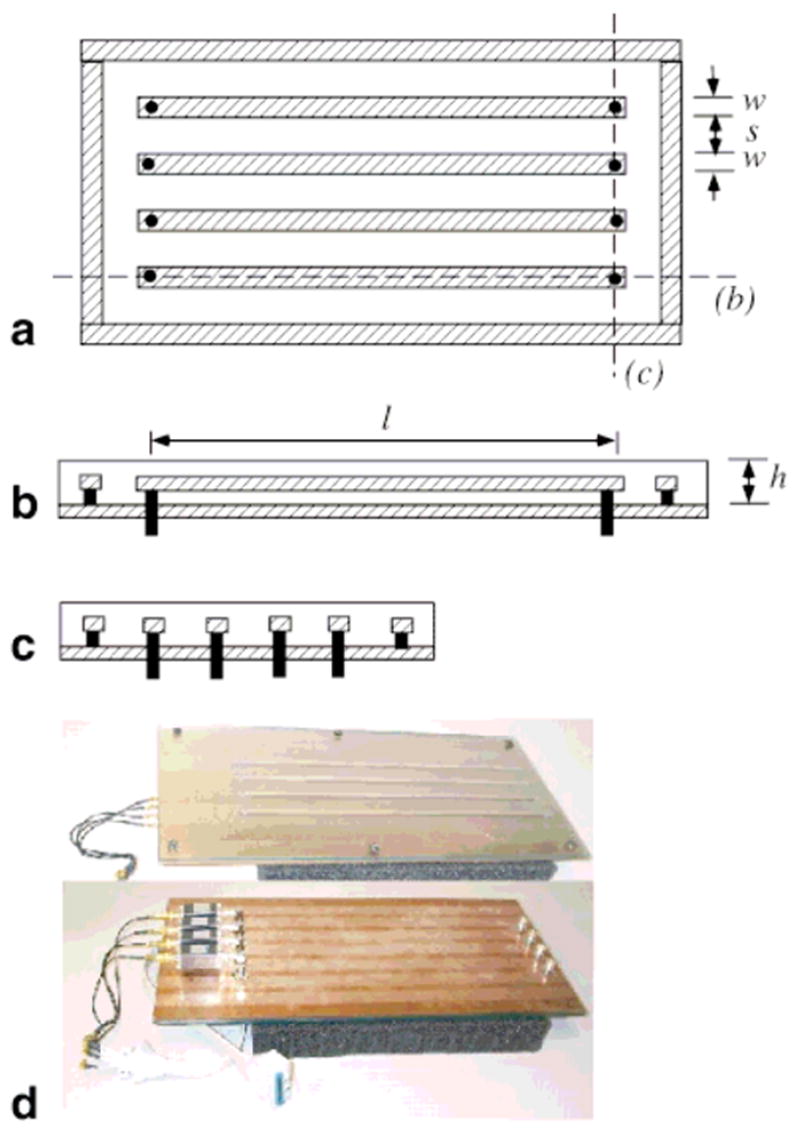
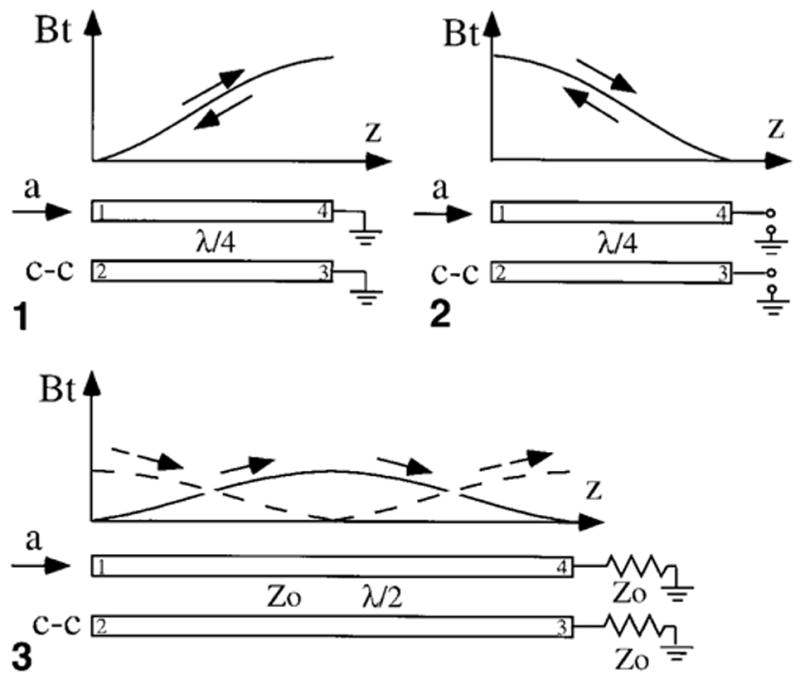
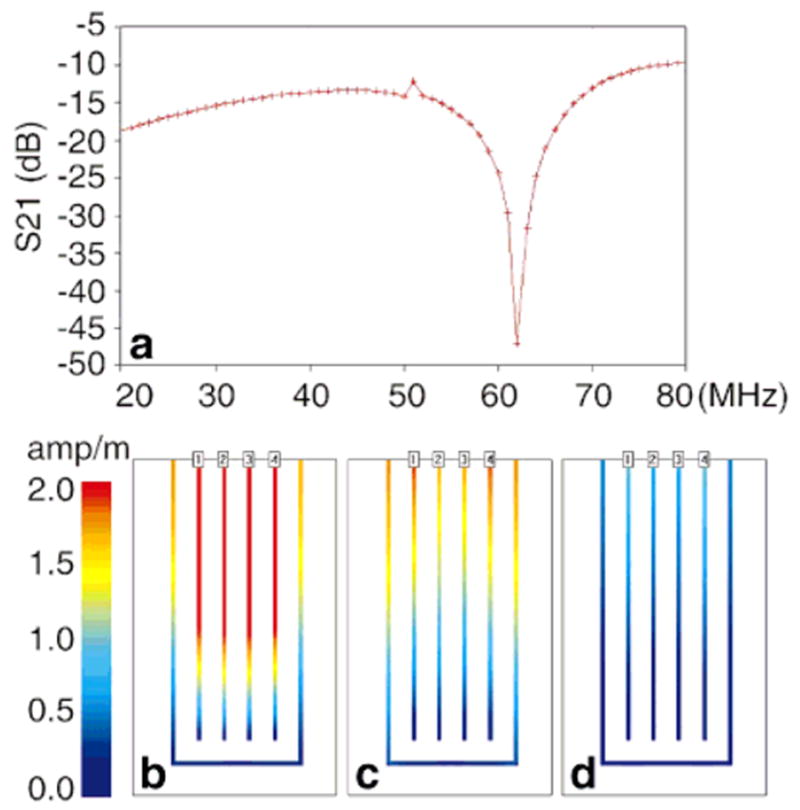
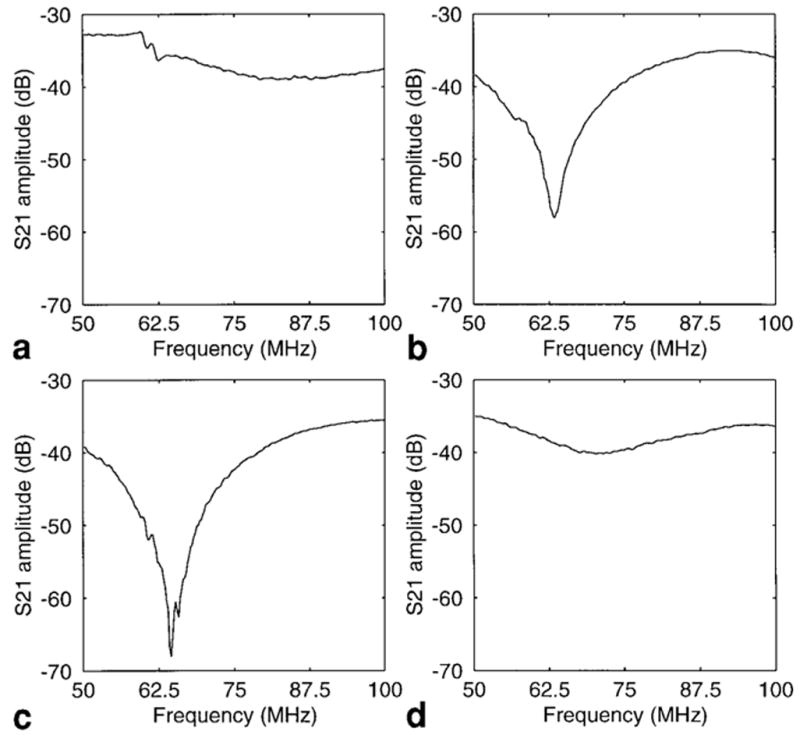
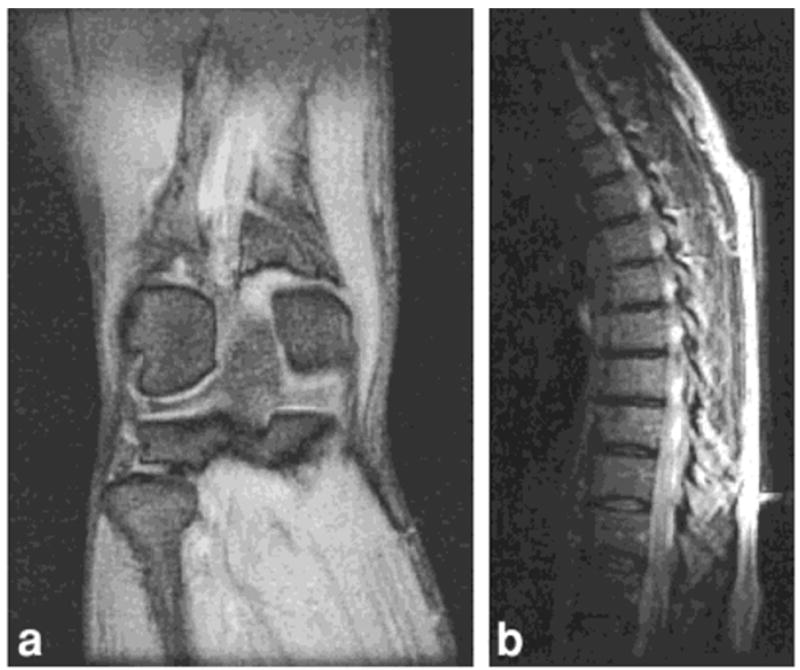
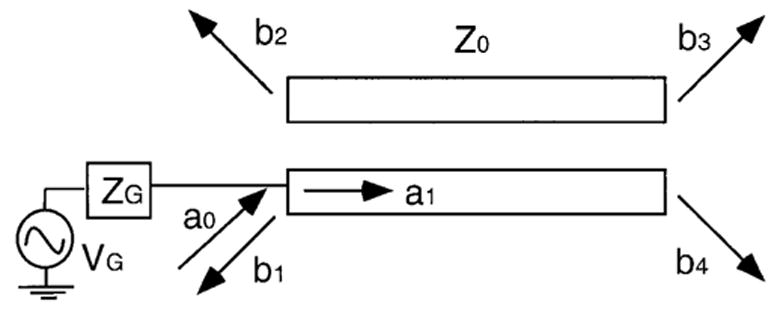
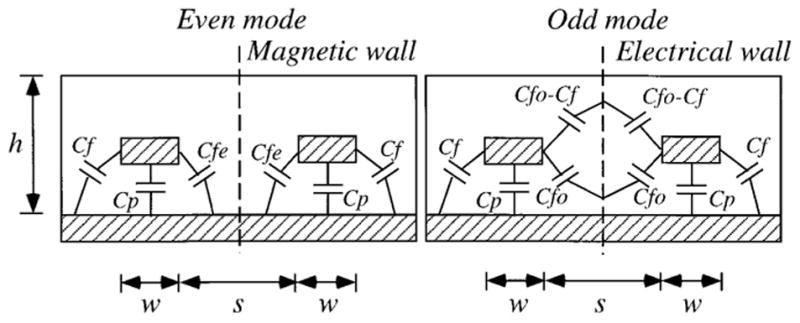
Parallel, spatial-encoded MRI requires a large number of independent detectors that simultaneously acquire signals. The loop structure and mutual coupling in conventional phased arrays limit the number of coils and therefore the potential reduction in minimum scan time achievable by parallel MRI tchniques. A new near-field MRI detector array, the planar strip array (PSA), is presented that eliminates the coupling problems and can be extended to a very large number of detectors and high MRI frequencies. Its basic structure is an array of parallel microstrips with a high permittivity substrate and overlay. The electromagnetic (EM) wavelength can be adjusted with the permittivity, and the strip lengths tuned to a preselected fraction of the wavelength of the MRI frequency. EM wave analysis and measurements on a prototype four-element PSA reveal that the coupling between the strips vanishes when the strip length is either an integer times a quarter wavelength for a standing-wave PSA, or a half wavelength for a travelling-wave PSA, independent of the spacing between the strips. The analysis, as well as phantom and human MRI experiments performed by conventional and parallel-encoded MRI with the PSA at 1.5 T, show that the decoupled strips produce a relatively high-quality factor and signal-to-noise ratio, provided that the strips are properly terminated, tuned, and matched or coupled to the preamplifiers. Magn Reson Med 45:673-683, 2001.


Figures

FIG. 1
FIG. 1
MRI signal detection by (a) loop and (b) linear antennas. Here z is the longitudinal direction that is parallel to the static magnetic field B0. The x-y plane is the transverse plane in which the transverse magnetization Mxy(r), originated at point O, rotates with frequency ω to generate a time-varying magnetic field B. In part a a loop antenna is used to detect B. The angle θ is the view angle from the point O. This angle provides the measure of how close the two sides of the loop are. In part b a linear antenna is used to detect B. The distance between point O and the linear antenna is r.
FIG. 2
FIG. 2
An end elevation view of the EM field of a linear antenna, a microstrip with a dielectric overlay. The substrate and overlay of the microstrip have the same dielectric constant, ∊r. Here J is the current induced by transverse magnetization, and Bt and Et are the TEM field associated with J.
FIG. 3
FIG. 3
Representation of a strip as a transmission line sandwiched between a source and a load. The transmission line can be described by an ABCD matrix. Its characteristic impedance of the transmission line is Z0, and the length of the line is l. d is the distance measured from the output point of the line. The source voltage is VG, the source impedance is ZG, and the load impedance is ZL. V1 and I1 are the input voltage and current. V2 and I2 are the output voltage and current.
FIG. 4
FIG. 4
The structure of the PSA: (a) planar view, (b) side elevation, and (c) end elevation. The conductor is shaded; black bars and circles correspond to BNC surface mounts. The four conducting strips are surrounded by a rectangular guard ring. The strips have width w, length l, and spacing s. The thickness of the dielectric medium is h. d shows photographs of the top (above) and underside (below) of the λ/4 PSA prototype.
FIG. 5
FIG. 5
The demonstration of the physical principle of the decoupling between the parallel transmission lines caused by field cancellations. Parts 1 and 2 show a pair of λ/4 transmission line resonators terminated with either a short or open circuit. If incident current is a, the standing wave on the strip is decomposed into a forward current a and a reflection current a. The transverse magnetic fields Bt generated by a and a induce coupling currents c and c in the adjacent strips, which cancel each other, resulting in no coupling between the two strips. Part 3 shows a pair of λ/2 transmission lines with matched loads. The increasing Bt and decreasing Bt generate coupling currents c and c, which also cancel each other, so there is no coupling between the two λ/2-matched transmission lines either.
FIG. 6
FIG. 6
The results of the transmission line analysis of the PSA. a: The simulated S21 response. b: The current distribution at 64 MHz with a strip length of a quarter wavelength, λ/4. There is no distinction among the signals on the four strips, and the standing wave makes the amplitude of the signal high. c: The current distribution at 48MHz, wherein the strip length is 3λ/16. d: The current distribution at 32MHz, wherein the strip length is λ/8. In both c and d, the coupling causes the signals on the center two strips to differ from the signals at the ends. However, a low standing-wave ratio makes the amplitude of the signals much weaker than in a.
FIG. 7
FIG. 7
The graphic solution of Eq. [11]. The solid line is the left side of the equation, and the dashed line is the right side of the equation. When s/h > 3, both sides of Eq. [11], and therefore the even- and odd-mode impedance, are equal. The vertical axis is an arbitrary unit.
FIG. 8
FIG. 8
S21 measurements of the prototype 64 MHz PSA recorded from the network analyzer, demonstrating both narrow- and broadband decoupling in (a and b) the SW-PSA and (c and d) the TW-PSA. Part a is the S21 of an unloaded, shorted λ/4 strip pair of the SW-PSA. Although broadband decoupling of 30–40 dB is evident, narrow-band decoupling at resonance cannot be seen due to the open circuit at the input. b: The S21 when the shorted λ/4 strip pair of the SW-PSA is loaded. The load causes a phase shift, revealing the narrow-band decoupling. c: The S21 of an unloaded, matched λ/2 strip pair of the TW-PSA. d: The S21 of the matched λ/2 strip pair of the TW-PSA when it is loaded. The SW-PSA has a much better performance than the TW-PSA when it is loaded (b vs. d).
FIG. 9
FIG. 9
(ac) Coronal images and (df) corresponding intensity profiles acquired from a water phantom oriented parallel with the strips, and at the same height from the surface of the SW- and TW-PSA. The length of the phantoms is the same as the length of the strips of the SW-PSA (46 cm) and the FOV of the images. Part a was acquired with the TW-PSA and shows a uniform signal density along the strips. Parts b and c were acquired with the SW-PSA terminated with open and short circuits, respectively. The regional variation in sensitivity is due to the standing wave. In parts df, the vertical axes are signal intensity (arbitrary units) and the horizontal axes are vertical pixel numbers of the corresponding images. The SW-PSA produces higher but less uniform SNR from the water phantom than does the TW-PSA.
FIG. 10
FIG. 10
ad: Axial images of each separate strip of the four-strip TW-PSA during a parallel detection from a GE Medical Systems standard phantom containing rectangular signal voids. The images, which correspond to the sensitivity profiles of each strip, show no mutual interference, even in regions where the elements have overlapping sensitivity. FOV = 28 cm.
FIG. 11
FIG. 11
Conventional images acquired with a four-channel PSA. a: A coronal gradient echo image of the human knee (NEX = 2, TR = 500 msec, TE = 11 msec, NEX = 2, 256 × 256 points, FOV = 32 cm). b: A fast spin-echo sagittal image of the human spine (NEX = 2, TR = 4 sec, TE = 102 msec, echo train length = 16, 256 × 160 points, receiver bandwidth 16 kHz).
FIG. 12
FIG. 12
Demonstration of partial parallel spatial-encoded MRI using the ASP method (3) with PSA on a GE Medical Systems standard resolution phantom with a horizontal void. ad: The decimated images from four channels of the PSA with a decimation factor of 2. e: The image reconstructed from this raw ASP PSA data showing substantial elimination of the residual aliasing artifacts. The images are acquired with a spin-echo sequence (coronal, TR = 1 sec, TE = minimum, FOV = 16 cm, NEX = 2).
FIG. 13
FIG. 13
Circuit diagram for even/odd mode analysis of a pair of transmission lines. VG is the source voltage; ZG is impedance of the source; a0 is the incident power wave (23) without reflection from the source; a1 is the incident power wave with reflection from the source; and b1, b2, b3, and b4 are the reflection or scatter power wave (23) from the four ports. The incident wave at port 1 is decomposed into even- and odd-mode power wave components. The even mode is comprised of incident waves a1/2 at both ports 1 and 2. The odd mode assumes is comprised of incident waves a1/2 at port 1, and −a1/2 at port 2. The superposition of both even and odd modes is equivalent to the incident wave a1 at port 1 only.
FIG. 14
FIG. 14
End elevation sketch of the PSA showing the distributed capacitance for even (left) and odd (right) modes of a pair of coupled strips. The vertical dashed lines indicate magnetic and electric “walls” where the magnetic and electric fields are zero (virtual ground for the electric field).

References

    1. Sodickson DK, Manning WJ. Simultaneous acquisition of spatial harmonics (SMASH): fast imaging with radiofrequency coil arrays. Magn Reson Med. 1997;38:591–603. - PubMed
    1. Pruessmann KP, Weiger M, Scheidegger MB, Boesiger P. SENSE: sensitivity encoding for fast MRI. Magn Reson Med. 1999;42:952–962. - PubMed
    1. Lee RF, Westgate CR, Weiss RG, Bottomley PA. An analytical SMASH procedure (ASP) for sensitivity-encoded MRI. Magn Reson Med. 2000;43:716–725. - PMC - PubMed
    1. Roemer PB, Edelstein WA, Hayes CE, Souza SP, Mueller OM. The NMR phased array. Magn Reson Med. 1990;16:192–225. - PubMed
    1. Wright SM, Magin RL, Kelton JR. Arrays of mutually coupled receiver coils: theory and application. Magn Reson Med. 1991;17:252–268. - PubMed

Publication types

MeSH terms