. 2001 Apr 2;153(1):111-20.
doi: 10.1083/jcb.153.1.111.

FtsZ ring formation at the chloroplast division site in plants

Affiliations

FtsZ ring formation at the chloroplast division site in plants

S Vitha et al. J Cell Biol. .

Abstract

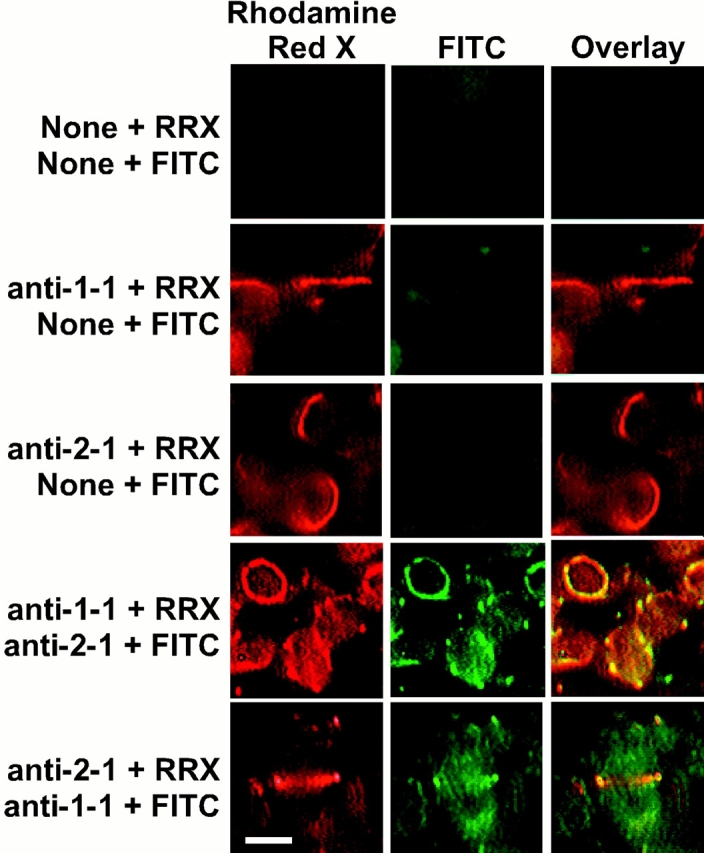
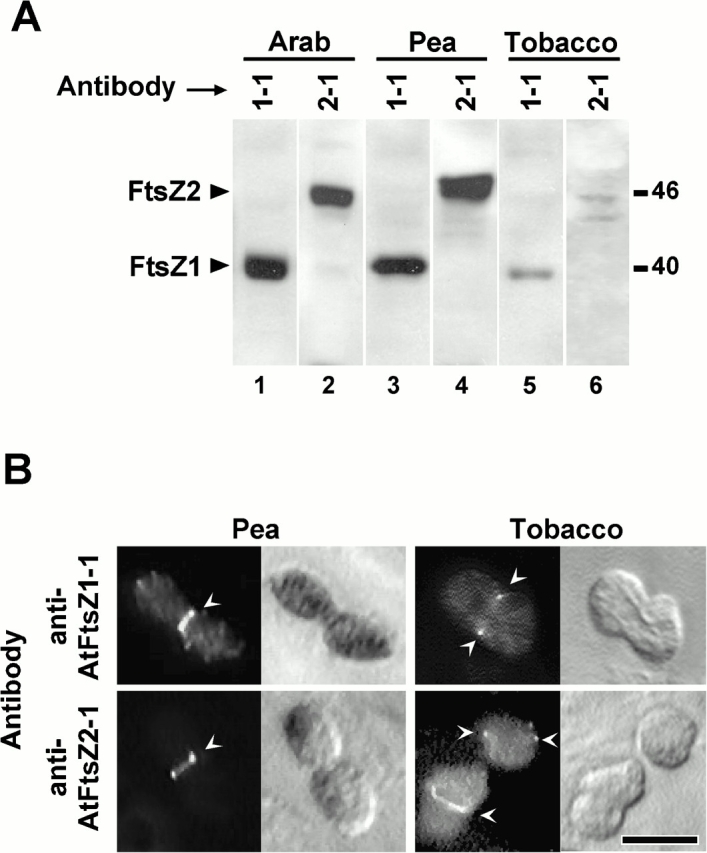
Among the events that accompanied the evolution of chloroplasts from their endosymbiotic ancestors was the host cell recruitment of the prokaryotic cell division protein FtsZ to function in chloroplast division. FtsZ, a structural homologue of tubulin, mediates cell division in bacteria by assembling into a ring at the midcell division site. In higher plants, two nuclear-encoded forms of FtsZ, FtsZ1 and FtsZ2, play essential and functionally distinct roles in chloroplast division, but whether this involves ring formation at the division site has not been determined previously. Using immunofluorescence microscopy and expression of green fluorescent protein fusion proteins in Arabidopsis thaliana, we demonstrate here that FtsZ1 and FtsZ2 localize to coaligned rings at the chloroplast midpoint. Antibodies specific for recognition of FtsZ1 or FtsZ2 proteins in Arabidopsis also recognize related polypeptides and detect midplastid rings in pea and tobacco, suggesting that midplastid ring formation by FtsZ1 and FtsZ2 is universal among flowering plants. Perturbation in the level of either protein in transgenic plants is accompanied by plastid division defects and assembly of FtsZ1 and FtsZ2 into filaments and filament networks not observed in wild-type, suggesting that previously described FtsZ-containing cytoskeletal-like networks in chloroplasts may be artifacts of FtsZ overexpression.


Figures

Figure 1
Figure 1
Immunofluorescence microscopy of AtFtsZ1-1 and AtFtsZ2-1 in Arabidopsis. Fixed, embedded leaf sections from 4-wk-old Arabidopsis plants were probed with affinity-purified polyclonal antibodies generated against peptides from either AtFtsZ1-1 or AtFtsZ2-1 (Stokes et al. 2000), followed by incubation with anti–rabbit secondary antibodies labeled with FITC. The fluorescence images in A, C, and D are accompanied by bright-field images to reveal the chloroplast shape. (A) Chloroplasts in sections from wild-type (left) and arc5 (right) probed with anti–AtFtsZ1-1 (top) or anti–AtFtsZ2-1 (bottom). (B) Optical sections through the bottom, middle, or top of chloroplasts from wild-type sections labeled with anti–AtFtsZ1-1 (top) or anti–AtFtsZ2-1 (bottom). The stack of images was rotated 30% and projected to reveal the complete FtsZ ring (far right). (C) Labeled sections from wild-type plants showing that AtFtsZ1-1 (left) and AtFtsZ2-1 (right) rings are present in virtually all mesophyll cell chloroplasts. (D) AtFtsZ1-1 (left) and AtFtsZ2-1 (right) labeling in a chloroplast at a late stage of constriction. Arrows show filaments spiraling off the central ring. The three-dimensional projections of the stack of optical sections can be rotated in the two videos available at http://www.jcb.org/cgi/content/full/153/1/111/DC1. Bars, 5 μm.
Figure 1
Figure 1
Immunofluorescence microscopy of AtFtsZ1-1 and AtFtsZ2-1 in Arabidopsis. Fixed, embedded leaf sections from 4-wk-old Arabidopsis plants were probed with affinity-purified polyclonal antibodies generated against peptides from either AtFtsZ1-1 or AtFtsZ2-1 (Stokes et al. 2000), followed by incubation with anti–rabbit secondary antibodies labeled with FITC. The fluorescence images in A, C, and D are accompanied by bright-field images to reveal the chloroplast shape. (A) Chloroplasts in sections from wild-type (left) and arc5 (right) probed with anti–AtFtsZ1-1 (top) or anti–AtFtsZ2-1 (bottom). (B) Optical sections through the bottom, middle, or top of chloroplasts from wild-type sections labeled with anti–AtFtsZ1-1 (top) or anti–AtFtsZ2-1 (bottom). The stack of images was rotated 30% and projected to reveal the complete FtsZ ring (far right). (C) Labeled sections from wild-type plants showing that AtFtsZ1-1 (left) and AtFtsZ2-1 (right) rings are present in virtually all mesophyll cell chloroplasts. (D) AtFtsZ1-1 (left) and AtFtsZ2-1 (right) labeling in a chloroplast at a late stage of constriction. Arrows show filaments spiraling off the central ring. The three-dimensional projections of the stack of optical sections can be rotated in the two videos available at http://www.jcb.org/cgi/content/full/153/1/111/DC1. Bars, 5 μm.
Figure 4
Figure 4
Localization AtFtsZ1-1–GFP or AtFtsZ1-1 in transgenic Arabidopsis plants. (A) Immunoblots of leaf extracts from wild-type plants (lanes 1 and 2), and transgenic plants expressing AtFtsZ1-1–GFP at low levels (lanes 3 and 4), AtFtsZ1-1–GFP at high levels (lanes 5 and 6), or AtFtsZ1-1 at high levels (lanes 7 and 8), were probed with affinity-purified anti–AtFtsZ1-1 (1-1) or anti–AtFtsZ2-1 (2-1) antibodies. The identities of the immunoreactive polypeptides and migration of molecular weight markers are shown at left and right, respectively. (B) In vivo fluorescence microscopy of AtFtsZ1-1–GFP in mesophyll cell chloroplasts (top) and corresponding bright-field images (bottom) from transgenic Arabidopsis plants of wild-type (left) or arc5 (right) background with low levels of the fusion protein. (C) In vivo GFP fluorescence in transgenic plants with low (left) or high (center) levels of AtFtsZ1-1–GFP, or immunofluorescence labeling of AtFtsZ1-1 in transgenic plants with high levels of AtFtsZ1-1 (right). All images are of mesophyll cells. Bright-field images are shown at bottom. The plants shown at left, center, and right are the same as those represented in lanes 3 and 4, 5 and 6, and 7 and 8 of A, respectively. (D) In vivo GFP fluorescence in pavement cells (left) or guard cells (right) of leaf epidermis in transgenic plants with high levels of AtFtsZ1-1–GFP. Arrowheads point to AtFtsZ1-1–GFP in epidermal chloroplasts; arrows (left) indicate AtFtsZ1-1–GFP in chloroplasts of underlying mesophyll cells that are also in the focal plane. Corresponding bright-field images are shown at bottom. Bars: (B) 5 μm; (C and D) 10 μm.
Figure 4
Figure 4
Localization AtFtsZ1-1–GFP or AtFtsZ1-1 in transgenic Arabidopsis plants. (A) Immunoblots of leaf extracts from wild-type plants (lanes 1 and 2), and transgenic plants expressing AtFtsZ1-1–GFP at low levels (lanes 3 and 4), AtFtsZ1-1–GFP at high levels (lanes 5 and 6), or AtFtsZ1-1 at high levels (lanes 7 and 8), were probed with affinity-purified anti–AtFtsZ1-1 (1-1) or anti–AtFtsZ2-1 (2-1) antibodies. The identities of the immunoreactive polypeptides and migration of molecular weight markers are shown at left and right, respectively. (B) In vivo fluorescence microscopy of AtFtsZ1-1–GFP in mesophyll cell chloroplasts (top) and corresponding bright-field images (bottom) from transgenic Arabidopsis plants of wild-type (left) or arc5 (right) background with low levels of the fusion protein. (C) In vivo GFP fluorescence in transgenic plants with low (left) or high (center) levels of AtFtsZ1-1–GFP, or immunofluorescence labeling of AtFtsZ1-1 in transgenic plants with high levels of AtFtsZ1-1 (right). All images are of mesophyll cells. Bright-field images are shown at bottom. The plants shown at left, center, and right are the same as those represented in lanes 3 and 4, 5 and 6, and 7 and 8 of A, respectively. (D) In vivo GFP fluorescence in pavement cells (left) or guard cells (right) of leaf epidermis in transgenic plants with high levels of AtFtsZ1-1–GFP. Arrowheads point to AtFtsZ1-1–GFP in epidermal chloroplasts; arrows (left) indicate AtFtsZ1-1–GFP in chloroplasts of underlying mesophyll cells that are also in the focal plane. Corresponding bright-field images are shown at bottom. Bars: (B) 5 μm; (C and D) 10 μm.
Figure 2
Figure 2
Specificity of anti–AtFtsZ1-1 and anti–AtFtsZ2-1 antibodies in situ. Leaf sections from Arabidopsis antisense plants depleted of either AtFtsZ1-1 (left) or AtFtsZ2-1 (right) (Stokes et al. 2000) were probed with affinity-purified antibodies directed against either AtFtsZ1-1 (top) or AtFtsZ2-1 (bottom). Labeling patterns were visualized by fluorescence microscopy. Chloroplast morphology is shown in adjacent bright-field images. Bar, 10 μm.
Figure 3
Figure 3
AtFtsZ1-1 and AtFtsZ2-1 rings are colocalized. Leaf sections from wild-type Arabidopsis plants were subjected to sequential, double immunofluorescence labeling of AtFtsZ1-1 and AtFtsZ2-1. The order of antibody application is indicated on the left. Tissue sections were incubated first with no antibodies (None), anti–AtFtsZ1-1 antibodies (anti–1-1), or anti–AtFtsZ2-1 antibodies (anti–2-1), followed by monovalent anti–rabbit antibody conjugated to Rhodamine red–X (RRX). Sections were then treated with no, anti–AtFtsZ1-1, or anti–AtFtsZ2-1 antibody, followed by anti–rabbit FITC conjugate. The labeled sections were viewed using FITC (green) and Texas red (red) filter sets. The yellow color in the overlay of the red and green signals indicates colocalization of AtFtsZ1-1 and AtFtsZ2-1. Bar, 2 μm.
Figure 5
Figure 5
Detection of FtsZ1 and FtsZ2 proteins in pea and tobacco. (A) Immunoblots of leaf extracts from Arabidopsis (lanes 1 and 2), pea (lanes 3 and 4), or tobacco (lanes 5 and 6) were probed with affinity-purified antibodies raised against Arabidopsis AtFtsZ1-1 (1-1) or AtFtsZ2-1 (2-1). The identities of the immunoreactive polypeptides and migration of molecular weight markers are shown at left and right, respectively. (B) Immunofluorescence labeling (arrowheads) in pea or tobacco leaf sections probed with anti–AtFtsZ1-1 (top) or anti–AtFtsZ2-1 (bottom) antibodies. Bright-field images are also shown. Bar, 5 μm.

References

    1. Beech P.L., Gilson P.R. FtsZ and organelle division in protists. Protist. 2000;151:11–16. - PubMed
    1. Beech P.L., Nheu T., Schultz T., Herbert S., Lithgow T., Gilson P.R., McFadden G.I. Mitochondrial FtsZ in a chromophyte alga. Science. 2000;287:1276–1279. - PubMed
    1. Bi E., Lutkenhaus J. FtsZ ring structure associated with division in Escherichia coli . Nature. 1991;354:161–164. - PubMed
    1. Bleazard W., McCaffery J.M., King E.J., Bale S., Mozdy A., Tieu Q., Nunnari J., Shaw J.M. The dynamin-related GTPase Dnm1 regulates mitochondrial fission in yeast. Nat. Cell Biol. 1999;1:298–304. - PMC - PubMed
    1. Bramhill D. Bacterial cell division. Annu. Rev. Cell Dev. Biol. 1997;13:395–424. - PubMed

Publication types