. 2001 May;21(9):3166-78.
doi: 10.1128/MCB.21.9.3166-3178.2001.

RNA polymerase III transcription complexes on chromosomal 5S rRNA genes in vivo: TFIIIB occupancy and promoter opening

Affiliations

RNA polymerase III transcription complexes on chromosomal 5S rRNA genes in vivo: TFIIIB occupancy and promoter opening

G Costanzo et al. Mol Cell Biol. 2001 May.

Abstract

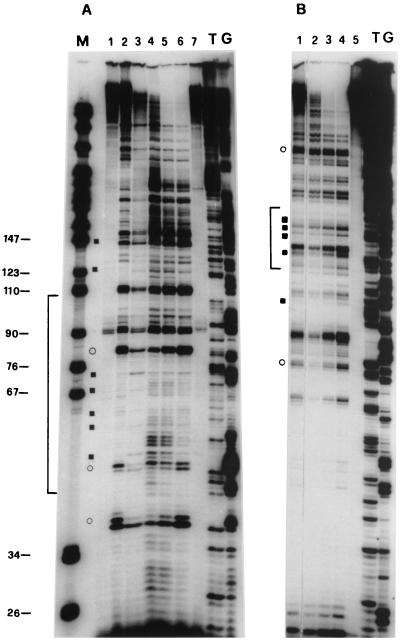
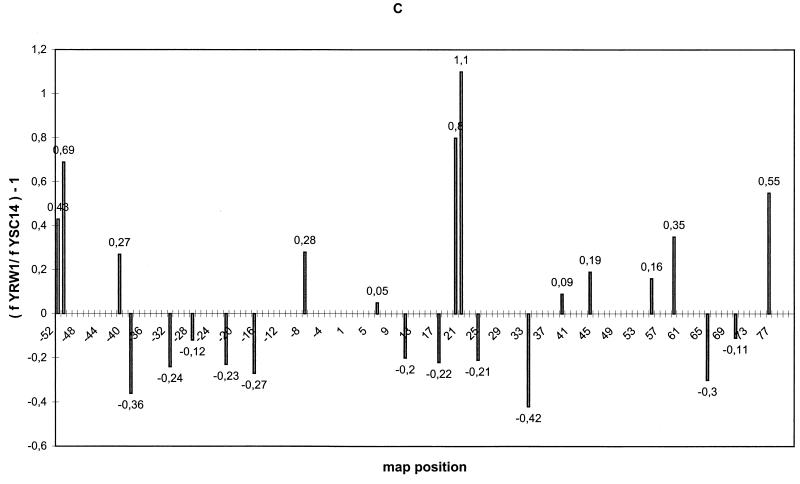
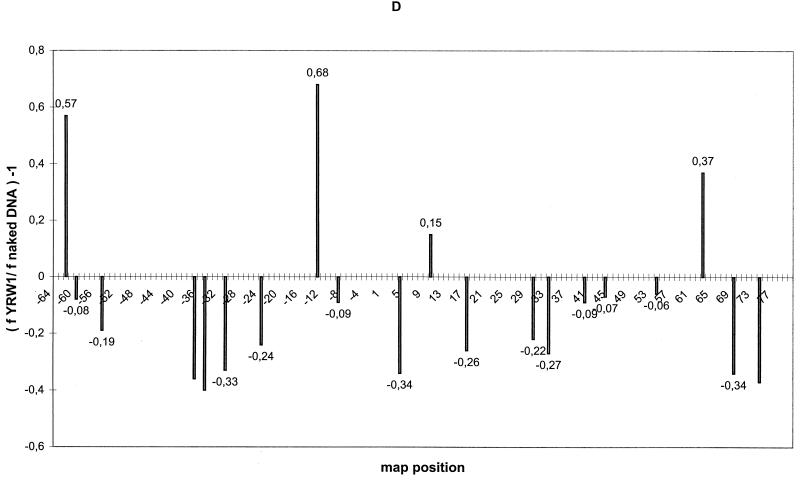
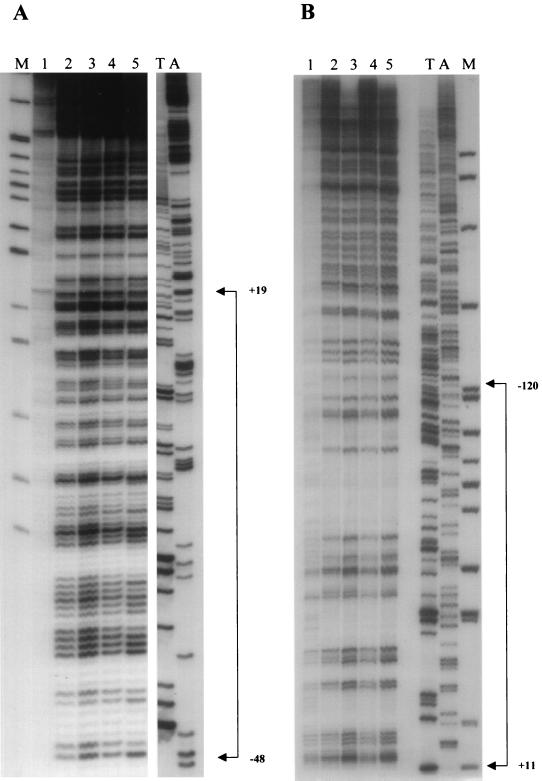
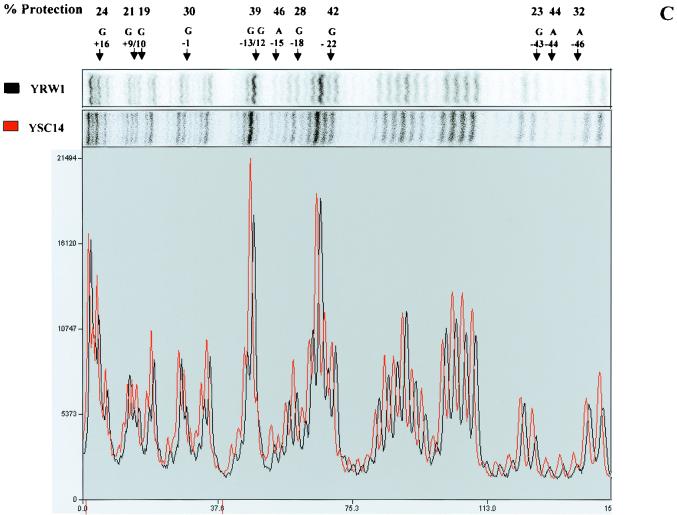
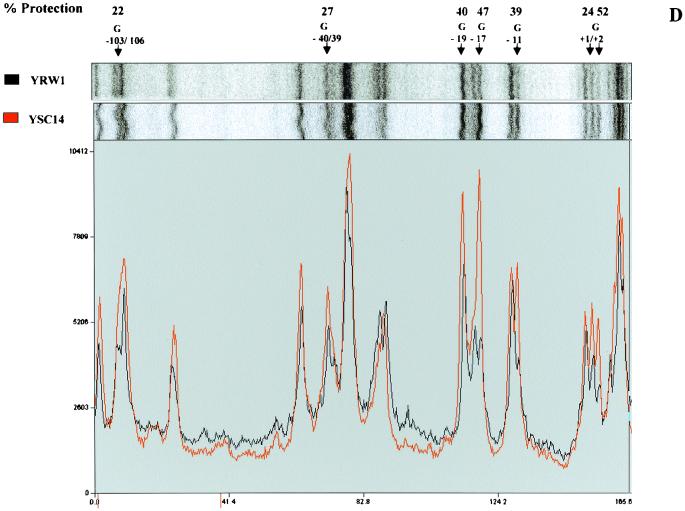
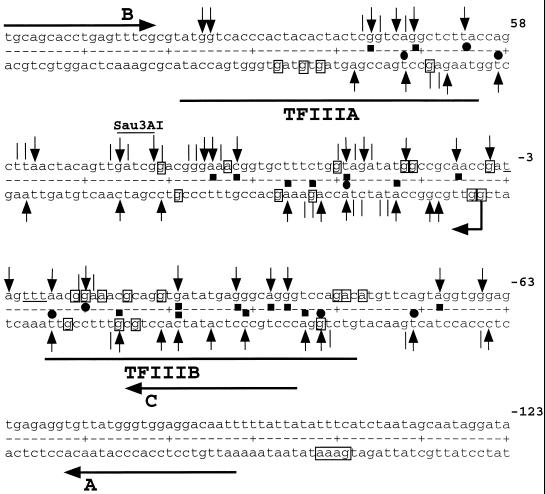
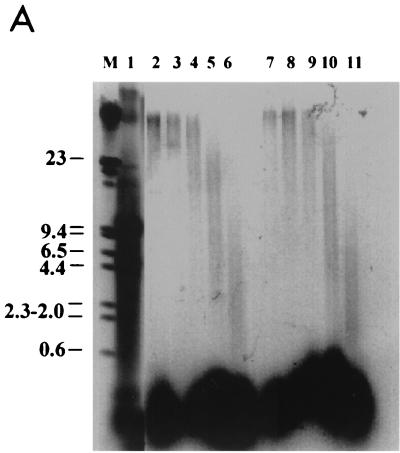
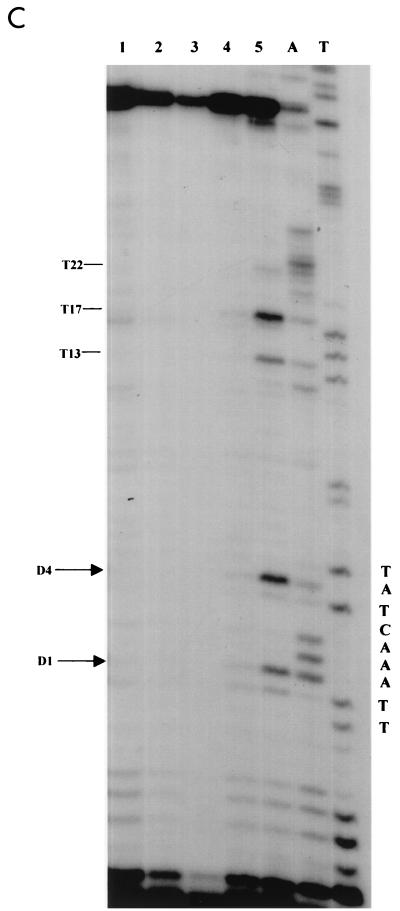
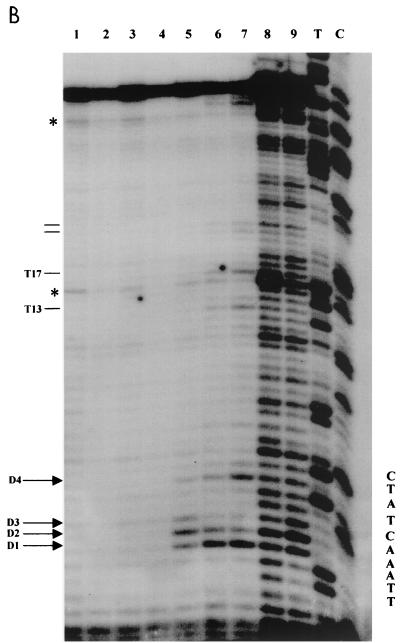
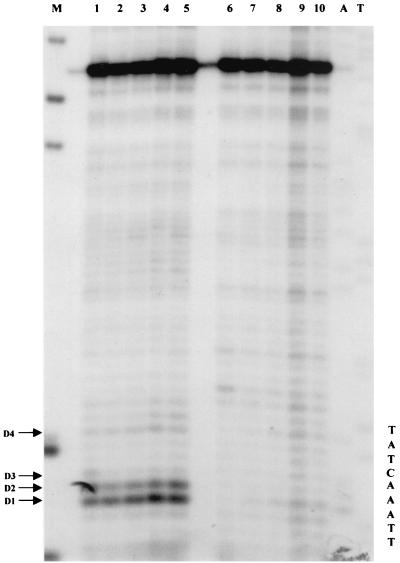
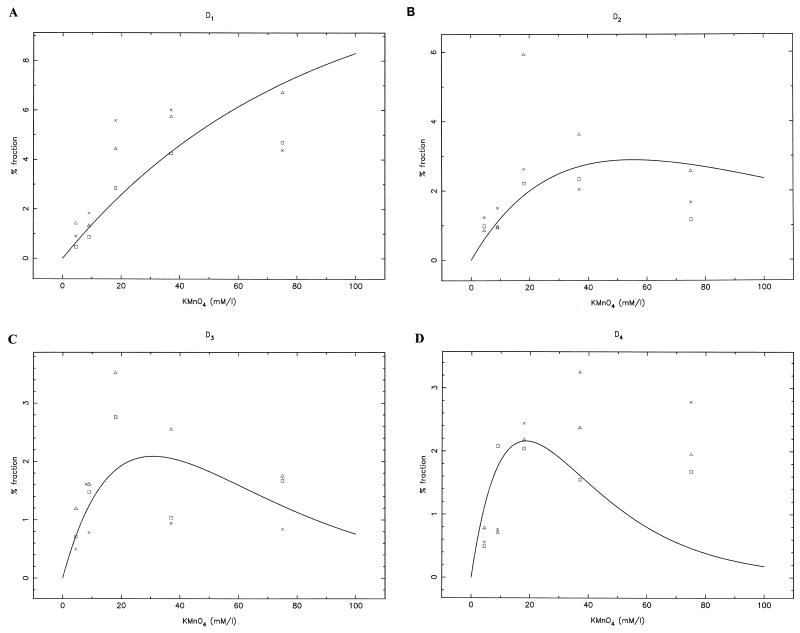
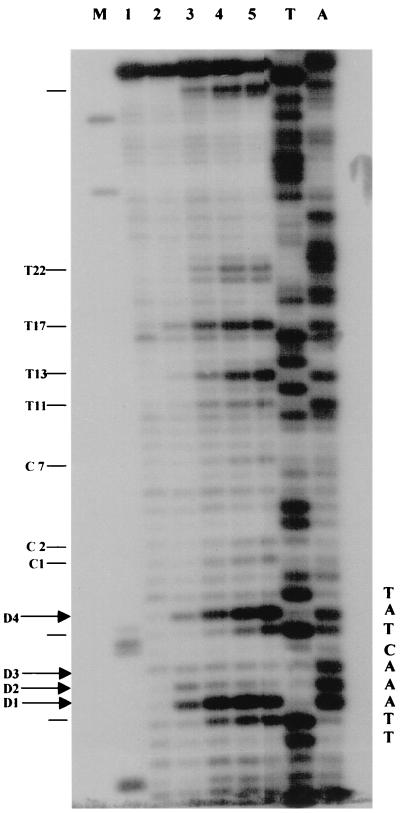
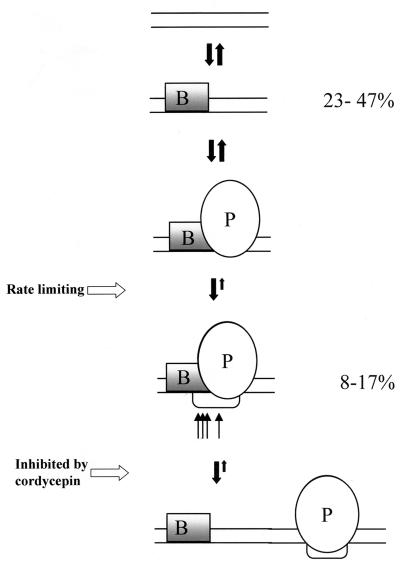
Quantitative analysis of multiple-hit potassium permanganate (KMnO(4)) footprinting has been carried out in vivo on Saccharomyces cerevisiae 5S rRNA genes. The results fix the number of open complexes at steady state in exponentially growing cells at between 8 and 17% of the 150 to 200 chromosomal copies. UV and dimethyl sulfate footprinting set the transcription factor TFIIIB occupancy at 23 to 47%. The comparison between the two values suggests that RNA polymerase III binding or promoter opening is the rate-limiting step in 5S rRNA transcription in vivo. Inhibition of RNA elongation in vivo by cordycepin confirms this result. An experimental system that is capable of providing information on the mechanistic steps involved in regulatory events in S. cerevisiae cells has been established.


Figures

FIG. 1
FIG. 1
UV footprinting on exponentially growing S. cerevisiae YRW1 and YSC14 cells. (A) Samples treated as described in Materials and Methods were primer extended with Taq polymerase (94°C for 45 s, 60°C for 1 min, and 72°C for 2 min for 30 cycles) using primer A (Fig. 3). After phenol extraction and ethanol precipitation, samples were analyzed on a 6% denaturing polyacrylamide gel. M, PBR322 MspI marker lane. The band length in base pair is indicated on the side. Lanes: 1, nonirradiated naked genomic DNA from strain YRW1; 2, genomic DNA from 8-min-irradiated strain YRW1; 3, genomic DNA from 8-min-irradiated strain YSC14; 4 to 6, naked genomic DNA irradiated for 30 s, 1 min, and 3 min, respectively; 7, unirradiated naked genomic DNA from strain YSC14; T and G, Sanger T and G sequencing lanes. Empty circles indicate selected increased pausing sites (enhancements) in strain YRW1 relative to strain YSC14; solid squares indicate selected decreased pausing sites (protections) in strain YRW1 relative to strain YSC14. The bracket indicates the position of the TFIIIB binding site. (B) Samples treated as described in Materials and Methods were primer extended with Taq polymerase (94°C for 45 s, 60°C for 1 min, and 72°C for 2 min for 30 cycles) using primer B (Fig. 3). After phenol extraction and ethanol precipitation, samples were analyzed on a 6% denaturing polyacrylamide gel. Lanes: 1, genomic DNA from 8-min-irradiated strain YRW1; 2 to 4, naked genomic DNA irradiated for 30 s, 1 min, and 3 min, respectively; 5, nonirradiated naked genomic DNA from strain YRW1; T and G, Sanger T and G sequencing lanes. Empty circles indicate selected increased pausing sites (enhancements) in strain YRW1; solid squares indicate selected decreased pausing sites (protections) in strain YRW1. The bracket indicates the position of the TFIIIB binding site. (C) Quantitation of the data in panel A. The intensity of UV-induced pausing sites was quantitated by scanning densitometry (see Materials and Methods). The x axis gives the site position in the gene sequence (Fig. 3); the y axis gives (f YRW1/ f YSC14) −1, where f is the band intensity, normalized to the total intensity of the scanned lane segment (from positions −52 to +77 in the gene). For YRW1 and YSC14 we used lanes 2 and 3, respectively. Negative numbers indicate protections; positive numbers indicate enhancements. (D) Quantitation of the data in panel B. The x axis gives the site position in the gene sequence (Fig. 3); the y axis gives (f YRW1/ f naked DNA) − 1, where f is the band intensity, normalized to the total intensity of the scanned lane segment (from positions −64 to +77 in the gene). For YRW1 and naked DNA we used lanes 1 and 3, respectively. Negative numbers indicate protections; positive numbers indicate enhancements. Data are the average of two independent experiments; ς = 0.092.
FIG. 1
FIG. 1
UV footprinting on exponentially growing S. cerevisiae YRW1 and YSC14 cells. (A) Samples treated as described in Materials and Methods were primer extended with Taq polymerase (94°C for 45 s, 60°C for 1 min, and 72°C for 2 min for 30 cycles) using primer A (Fig. 3). After phenol extraction and ethanol precipitation, samples were analyzed on a 6% denaturing polyacrylamide gel. M, PBR322 MspI marker lane. The band length in base pair is indicated on the side. Lanes: 1, nonirradiated naked genomic DNA from strain YRW1; 2, genomic DNA from 8-min-irradiated strain YRW1; 3, genomic DNA from 8-min-irradiated strain YSC14; 4 to 6, naked genomic DNA irradiated for 30 s, 1 min, and 3 min, respectively; 7, unirradiated naked genomic DNA from strain YSC14; T and G, Sanger T and G sequencing lanes. Empty circles indicate selected increased pausing sites (enhancements) in strain YRW1 relative to strain YSC14; solid squares indicate selected decreased pausing sites (protections) in strain YRW1 relative to strain YSC14. The bracket indicates the position of the TFIIIB binding site. (B) Samples treated as described in Materials and Methods were primer extended with Taq polymerase (94°C for 45 s, 60°C for 1 min, and 72°C for 2 min for 30 cycles) using primer B (Fig. 3). After phenol extraction and ethanol precipitation, samples were analyzed on a 6% denaturing polyacrylamide gel. Lanes: 1, genomic DNA from 8-min-irradiated strain YRW1; 2 to 4, naked genomic DNA irradiated for 30 s, 1 min, and 3 min, respectively; 5, nonirradiated naked genomic DNA from strain YRW1; T and G, Sanger T and G sequencing lanes. Empty circles indicate selected increased pausing sites (enhancements) in strain YRW1; solid squares indicate selected decreased pausing sites (protections) in strain YRW1. The bracket indicates the position of the TFIIIB binding site. (C) Quantitation of the data in panel A. The intensity of UV-induced pausing sites was quantitated by scanning densitometry (see Materials and Methods). The x axis gives the site position in the gene sequence (Fig. 3); the y axis gives (f YRW1/ f YSC14) −1, where f is the band intensity, normalized to the total intensity of the scanned lane segment (from positions −52 to +77 in the gene). For YRW1 and YSC14 we used lanes 2 and 3, respectively. Negative numbers indicate protections; positive numbers indicate enhancements. (D) Quantitation of the data in panel B. The x axis gives the site position in the gene sequence (Fig. 3); the y axis gives (f YRW1/ f naked DNA) − 1, where f is the band intensity, normalized to the total intensity of the scanned lane segment (from positions −64 to +77 in the gene). For YRW1 and naked DNA we used lanes 1 and 3, respectively. Negative numbers indicate protections; positive numbers indicate enhancements. Data are the average of two independent experiments; ς = 0.092.
FIG. 2
FIG. 2
DMS footprinting on exponentially growing S. cerevisiae YRW1 and YSC14 cells. (A) Samples treated as described in Materials and Methods were primer extended with Vent (Exo −) polymerase (94°C for 2 min, 60°C for 10 min, and 76°C for 2 min for 12 cycles) using primer A (Fig. 3). After phenol extraction and ethanol precipitation, samples were analyzed on a 6% denaturing polyacrylamide gel. M, PBR322 MspI marker lane. Lanes: 1, untreated naked genomic DNA from strain YRW1; 2, genomic DNA from strain YRW1 treated with 1 μl of DMS for 1 min; 3, genomic DNA from strain YRW1 treated with 1 μl of DMS for 3 min; 4, genomic DNA from strain YSC14 treated with 1 μl of DMS for 1 min; 5, genomic DNA from strain YSC14 treated with 1 μl of DMS for 3 min; T and A, Sanger T and A sequencing lanes. The area considered in the quantitative analysis is indicated on the right side. (B) As in panel A, but samples were primer extended using primer B. (C) A portion of the DMS footprinting patterns shown in panel A (lanes 2 and 4) was analyzed with a phosphorimager (see Materials and Methods). The images are shown in the upper part. The lower part shows the two overlapped densitometric profiles. Note that the densitograms are slightly shifted on the x axis. At the top of the panel, the arrows indicate the position of the residues significantly (≥19% [see Materials and Methods]) protected from methylation in the YRW1 strain and the percent protection (obtained as the ratio of the normalized band intensities multiplied by 100; normalization to the total lane intensity). A single value is given for −12 and −13 guanines overlapping peaks. (D) A portion of the DMS footprinting patterns shown in panel B (lanes 2 and 4) was analyzed with a phosphorimager (see Materials and Methods). The produced images are shown in the upper part. The lower part shows the two overlapped densitometric profiles. At the top of the panel, the arrows indicate the position of the residues significantly (≥19%) protected from methylation in the YRW1 strain and the percent protection (obtained as the ratio of the normalized band intensities multiplied by 100; normalization to the total lane intensity). A single value is given for −103 to −106 purines overlapping peaks.
FIG. 2
FIG. 2
DMS footprinting on exponentially growing S. cerevisiae YRW1 and YSC14 cells. (A) Samples treated as described in Materials and Methods were primer extended with Vent (Exo −) polymerase (94°C for 2 min, 60°C for 10 min, and 76°C for 2 min for 12 cycles) using primer A (Fig. 3). After phenol extraction and ethanol precipitation, samples were analyzed on a 6% denaturing polyacrylamide gel. M, PBR322 MspI marker lane. Lanes: 1, untreated naked genomic DNA from strain YRW1; 2, genomic DNA from strain YRW1 treated with 1 μl of DMS for 1 min; 3, genomic DNA from strain YRW1 treated with 1 μl of DMS for 3 min; 4, genomic DNA from strain YSC14 treated with 1 μl of DMS for 1 min; 5, genomic DNA from strain YSC14 treated with 1 μl of DMS for 3 min; T and A, Sanger T and A sequencing lanes. The area considered in the quantitative analysis is indicated on the right side. (B) As in panel A, but samples were primer extended using primer B. (C) A portion of the DMS footprinting patterns shown in panel A (lanes 2 and 4) was analyzed with a phosphorimager (see Materials and Methods). The images are shown in the upper part. The lower part shows the two overlapped densitometric profiles. Note that the densitograms are slightly shifted on the x axis. At the top of the panel, the arrows indicate the position of the residues significantly (≥19% [see Materials and Methods]) protected from methylation in the YRW1 strain and the percent protection (obtained as the ratio of the normalized band intensities multiplied by 100; normalization to the total lane intensity). A single value is given for −12 and −13 guanines overlapping peaks. (D) A portion of the DMS footprinting patterns shown in panel B (lanes 2 and 4) was analyzed with a phosphorimager (see Materials and Methods). The produced images are shown in the upper part. The lower part shows the two overlapped densitometric profiles. At the top of the panel, the arrows indicate the position of the residues significantly (≥19%) protected from methylation in the YRW1 strain and the percent protection (obtained as the ratio of the normalized band intensities multiplied by 100; normalization to the total lane intensity). A single value is given for −103 to −106 purines overlapping peaks.
FIG. 3
FIG. 3
Map of 5S rDNA. Upper strand, transcribed; lower strand, nontranscribed. Numbering is relative to the transcription start. Vertical arrows indicate major UV-induced pausing sites; vertical lines indicate minor UV-induced pausing sites. Solid squares indicate protection of ≥20%; solid circles indicate enhancements of ≥20% (symbols above and below the dotted line refer to the upper and lower strand, respectively). Bent arrow indicates transcription start. The DMS-protected residues (protection, ≥19%) are boxed, and the four KMnO4-reactive thymines, D1, D2, D3, and D4, are underlined. The Sau3AI restriction site indicated. TFIIIB and TFIIA in vitro-protected domains (thick horizontal lines) are as in reference (nontranscribed strand). Primers A, B, and C are indicated by horizontal arrows.
FIG. 4
FIG. 4
KMnO4 titration on S. cerevisiae YRW1 and YSC14 cells. (A) YRW1 (lanes 2 to 6) and YSC14 (lanes 7 to 11) cells were treated with 4.5, 9, 18, 37, or 75 mM KMnO4 and genomic DNA was purified. Samples were heated for 3 min at 95°C in loading buffer (50 mM NaOH, 1 mM EDTA, 2.5% Ficoll; 0.25% bromocresol green) and run in a 1% agarose denaturing gel in 50 mM NaCl–50 mM NaOH–1 mM EDTA as running buffer. M, length markers; lane 1, untreated naked genomic DNA. (B) YRW1 cells were treated and genomic DNA was purified and restricted with Sau3AI as in Materials and Methods. Samples were primer extended with Taq polymerase (94°C for 45 s, 60°C for 1 min, and 72°C for 2 min for 30 cycles) using primer C (Fig. 3). Lanes: 1, unreacted naked genomic DNA; 2 to 7, cells treated for 2 min at 22°C with 2, 4.5, 9, 18, 37, or 75 mM KMnO4; 8 and 9, naked genomic DNA treated for 2 min at 22°C with 1 or 4 mM KMnO4; T and C, Sanger T and C sequencing lanes (a relevant portion of the sequence is reported). The position of in vivo-reactive pyrimidines is indicated on the side. Asterisks indicate KMnO4-independent pausing sites. (C) YSC14 cells were treated and genomic DNA was purified and restricted with Sau3AI as in Materials and Methods. Samples were primer extended with Taq polymerase (94°C for 45 s, 60°C for 1 min, and 72°C for 2 min for 30 cycles) using primer C (Fig. 3). Lanes; 1 to 5, cells treated for 2 min at 22°C with 4.5, 9, 18, 37, or 75 mM KMnO4; A and T, Sanger A and T sequencing lanes (a relevant portion of the sequence is reported). The position of in vivo-reactive pyrimidines is indicated on the side. Asterisks indicate KMnO4-independent pausing sites.
FIG. 4
FIG. 4
KMnO4 titration on S. cerevisiae YRW1 and YSC14 cells. (A) YRW1 (lanes 2 to 6) and YSC14 (lanes 7 to 11) cells were treated with 4.5, 9, 18, 37, or 75 mM KMnO4 and genomic DNA was purified. Samples were heated for 3 min at 95°C in loading buffer (50 mM NaOH, 1 mM EDTA, 2.5% Ficoll; 0.25% bromocresol green) and run in a 1% agarose denaturing gel in 50 mM NaCl–50 mM NaOH–1 mM EDTA as running buffer. M, length markers; lane 1, untreated naked genomic DNA. (B) YRW1 cells were treated and genomic DNA was purified and restricted with Sau3AI as in Materials and Methods. Samples were primer extended with Taq polymerase (94°C for 45 s, 60°C for 1 min, and 72°C for 2 min for 30 cycles) using primer C (Fig. 3). Lanes: 1, unreacted naked genomic DNA; 2 to 7, cells treated for 2 min at 22°C with 2, 4.5, 9, 18, 37, or 75 mM KMnO4; 8 and 9, naked genomic DNA treated for 2 min at 22°C with 1 or 4 mM KMnO4; T and C, Sanger T and C sequencing lanes (a relevant portion of the sequence is reported). The position of in vivo-reactive pyrimidines is indicated on the side. Asterisks indicate KMnO4-independent pausing sites. (C) YSC14 cells were treated and genomic DNA was purified and restricted with Sau3AI as in Materials and Methods. Samples were primer extended with Taq polymerase (94°C for 45 s, 60°C for 1 min, and 72°C for 2 min for 30 cycles) using primer C (Fig. 3). Lanes; 1 to 5, cells treated for 2 min at 22°C with 4.5, 9, 18, 37, or 75 mM KMnO4; A and T, Sanger A and T sequencing lanes (a relevant portion of the sequence is reported). The position of in vivo-reactive pyrimidines is indicated on the side. Asterisks indicate KMnO4-independent pausing sites.
FIG. 5
FIG. 5
Time course of KMnO4 reaction on S. cerevisiae YRW1 and YSC14 cells. YRW1 (lanes 1 to 5) or YSC14 (lanes 6 to 10) cells were treated with 20 mM KMnO4 for 15, 30, 60, 120, or 240 s and genomic DNA was purified and restricted with Sau3AI as in Materials and Methods. Samples were primer extended with Taq polymerase (94°C for 45 s, 60°C for 1 min, and 72°C for 2 min for 30 cycles) using primer C (Fig. 3). A and T, Sanger A and T sequencing lanes (a relevant portion of the sequence is reported); M, PBR322 MspI marker lane. The positions of in vivo-reactive pyrimidines are indicated on the side.
FIG. 6
FIG. 6
Quantitative analysis of KMnO4 titration on S. cerevisiae YRW1 cells. Shown are plots of the KMnO4-induced pausing fraction versus reagent concentration (see Materials and Methods) for D1 (A), D2 (B), D3 (C), and D4 (D). Data from three independent experiments are shown. The theoretical curves are the best global fit of the data (to equations 2 to 5 [see Materials and Methods]).
FIG. 7
FIG. 7
Effects of cordycepin triphosphate treatment on KMnO4 in vivo reactivity. (A) YRW1 cells were incubated with cordycepin triphosphate and then immediately reacted with KMnO4 as in Materials and Methods; genomic DNA purified and restricted with Sau3AI was primer extended with Taq polymerase: (94°C for 45 sec, 60°C for 1 min, and 72°C for 2 min for 30 cycles) using primer C (Fig. 3). Lanes: 1 to 5, cells treated for 2 min at 22°C with 4.5, 9, 18, 37, or 75 mM KMnO4; M, PBR322 MspI marker lane; A and T, Sanger A and T sequencing lanes (a relevant portion of the sequence is reported). The position of in vivo reactive pyrimidines is indicated on the side.
FIG. 8
FIG. 8
Cartoon diagram illustrating the interpretation of the results presented. B, TFIIIB; P, RNA polymerase III; thin arrows, KMnO4-hypersensitive sites. The mechanism presented is purely hypothetical.

Similar articles

Cited by

References

    1. Axelrod J D, Majors J. An improved method for photofootprinting yeast genes in vivo using Taq polymerase. Nucleic Acids Res. 1989;17:172–183. - PMC - PubMed
    1. Bartholomew B, Braun B R, Kassavetis G A, Geiduschek E P. Probing close DNA contacts of RNA polymerase III transcription complexes with the photoreactive nucleoside 4-thiodeoxythymidine. J Biol Chem. 1994;269:18090–18095. - PubMed
    1. Becker M M, Wang J C. Use of light for footprinting DNA in vivo. Nature. 1984;309:682–687. - PubMed
    1. Becker M M, Lesser D, Kurpiewsky M, Baranger A, Jen-Jacobson L. Ultraviolet footprinting accurately maps sequence-specific contacts and DNA kinking in the EcoRI endonuclease-DNA complex. Proc Natl Acad Sci USA. 1988;85:6247–6251. - PMC - PubMed
    1. Becker M M, Wang Z. Visualising intimate protein-DNA contacts and altered DNA structures with ultraviolet light. Biomethods. 1991;5:59–69.

Publication types

LinkOut - more resources