. 2001 Apr 10;98(8):4575-80.
doi: 10.1073/pnas.071055798. Epub 2001 Apr 3.

ANX7, a candidate tumor suppressor gene for prostate cancer

Affiliations

ANX7, a candidate tumor suppressor gene for prostate cancer

M Srivastava et al. Proc Natl Acad Sci U S A. .

Abstract

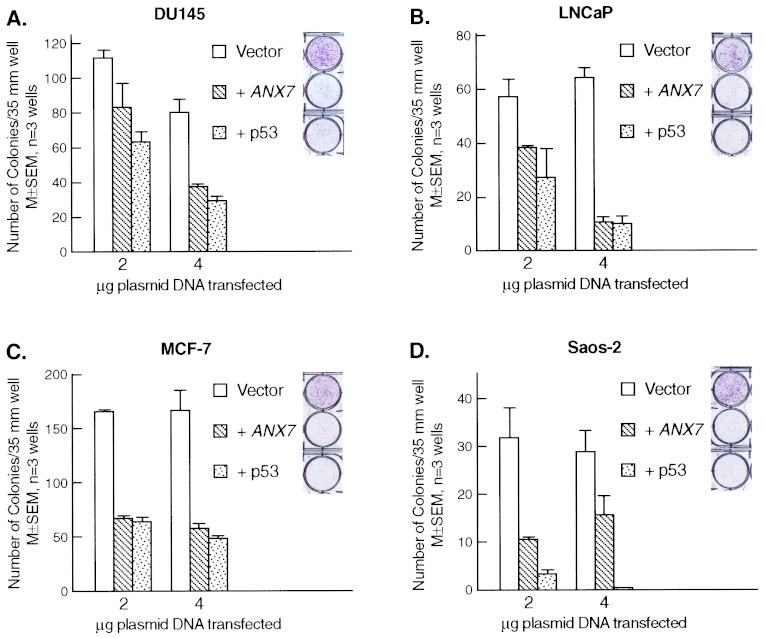
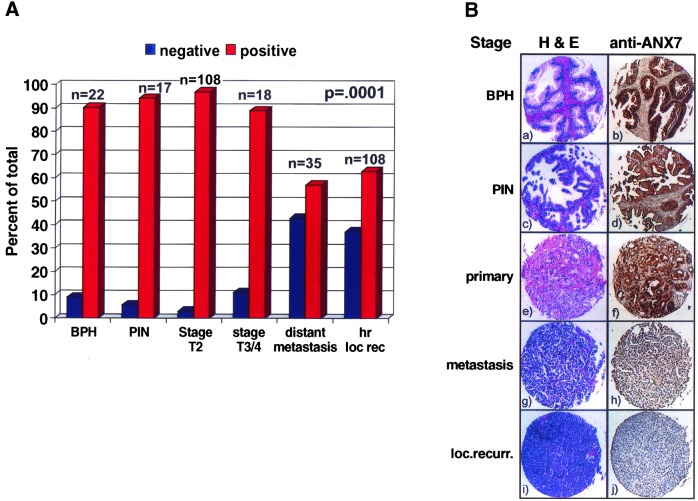
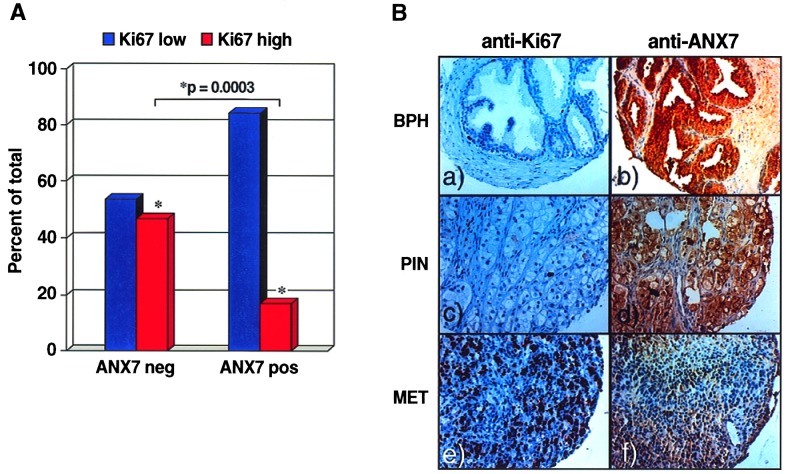
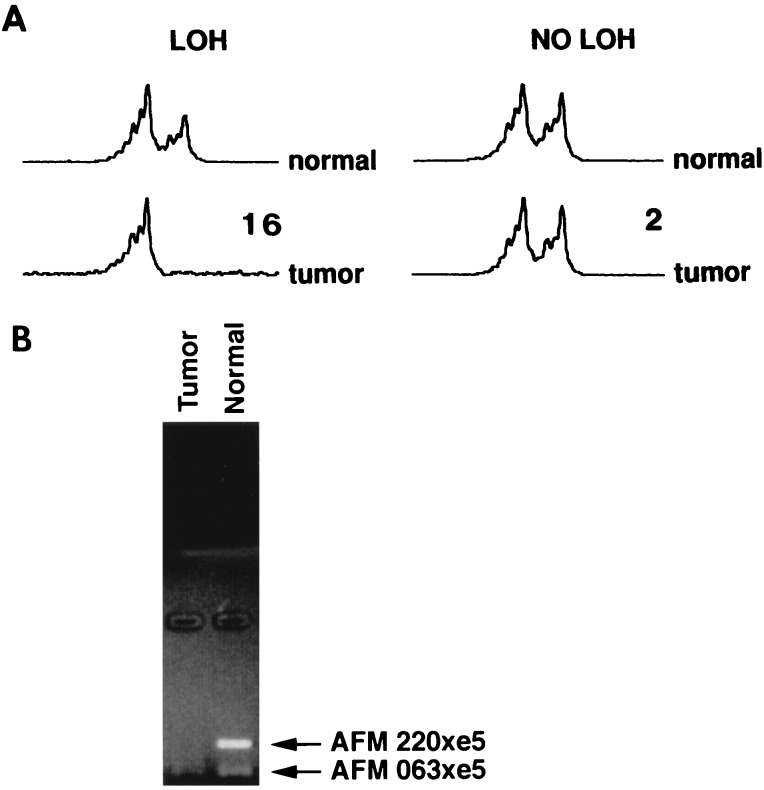
The ANX7 gene is located on human chromosome 10q21, a site long hypothesized to harbor a tumor suppressor gene(s) (TSG) associated with prostate and other cancers. To test whether ANX7 might be a candidate TSG, we examined the ANX7-dependent suppression of human tumor cell growth, stage-specific ANX7 expression in 301 prostate specimens on a prostate tissue microarray, and loss of heterozygosity (LOH) of microsatellite markers at or near the ANX7 locus. Here we report that human tumor cell proliferation and colony formation are markedly reduced when the wild-type ANX7 gene is transfected into two prostate tumor cell lines, LNCaP and DU145. Consistently, analysis of ANX7 protein expression in human prostate tumor microarrays reveals a significantly higher rate of loss of ANX7 expression in metastatic and local recurrences of hormone refractory prostate cancer as compared with primary tumors (P = 0.0001). Using four microsatellite markers at or near the ANX7 locus, and laser capture microdissected tumor cells, 35% of the 20 primary prostate tumors show LOH. The microsatellite marker closest to the ANX7 locus showed the highest rate of LOH, including one homozygous deletion. We conclude that the ANX7 gene exhibits many biological and genetic properties expected of a TSG and may play a role in prostate cancer progression.


Figures

Figure 1
Figure 1
Growth suppression of tumor cells by ANX7 and p53. (A) DU145 prostate cancer cells are transfected with pcDNA3.1 alone (vector) or vector expressing ANX7 (+ANX7) or p53 (+p53) and selected for plasmid-containing cells with G418 for ≈2 weeks. Surviving cells then were fixed and stained with crystal violet. Colonies were counted and displayed as histograms. For each cell line, a photograph of one well of cells treated with 4 μg of each plasmid is also shown. (B) LNCaP prostate cancer cells are treated exactly as indicated in A. (C) MCF-7 breast cancer cells are treated exactly as indicated in A. (D) Saos-2 osteosarcoma cells are treated exactly as indicated in A.
Figure 2
Figure 2
Levels of ANX7 protein expression in a prostate cancer tissue microarray. (A) Loss of expression of ANX7 during prostate cancer progression. BPH: benign prostatic hyperplesia; PIN: high-grade prostatic intraepithelial neoplesia; stage T2: clinically localized primary cancer; stage T3/T4: locally advanced primary cancer; Hr loc re: hormone refractory local recurrence. (B) Representative sections of the hemotoxylin-eosin (H&E) and immunohistochemical staining of ANX7 protein using monoclonal anti-ANX7 antibody on the prostate cancer tissue microarray (original magnification: ×100).
Figure 3
Figure 3
Levels of ANX7 protein expression and tumor cell proliferation. (A) Relationship between ANX7 expression and Ki67 tumor growth fraction. (B) Representative sections of immunohistochemical staining of Ki67 (Left) and ANX7 (Right) on the prostate tissue microarray (original magnification: ×200). (a and b) Benign prostatic hyperplasia (BPH). (c and d) Primary untreated prostate cancer with only a few scattered Ki67 positive nuclei, but strong ANX7 immunoreactivity. PIN, prostatic intraepithelial neoplasias. (e and f) Distant metastasis (MET) with a high fraction of Ki67-positive tumor cell nuclei and lack of ANX7 immunostaining.
Figure 4
Figure 4
LOH analysis using microsatellite markers on the chromosome 10q21 locus. (A) LOH analysis by microcapillary electrophoresis and data analysis with the Applied Biosystems 310 genetic analyzer in representative samples. LOH was scored by comparing the peak heights of tumor DNA and matched normal DNA. (B) Tumor and normal tissue DNA were prepared from 20 patients and analyzed for LOH as described in Materials and Methods. Arrows indicate alleles showing loss. Tumor of patient 17 shows homozygous deletion with AFM220xe5. No such loss was noted when the same sample was coamplified with another microsatellite marker AFM063xc5.

Similar articles

Cited by

References

    1. Creutz C E, Pazoles C J, Pollard H B. J Biol Chem. 1978;253:2858–2866. - PubMed
    1. Creutz E C, Pazoles C J, Pollard H B. J Biol Chem. 1979;254:553–558. - PubMed
    1. Raynal P, Pollard H B. Biochim Biophys Acta Biomembranes. 1994;1197:63–93. - PubMed
    1. Caohuy H, Srivastava M, Pollard H B. Proc Natl Acad Sci USA. 1996;93:10797–10802. - PMC - PubMed
    1. Shirvan A, Srivastava M, Wang M A, Cultraro C, Magendzo K, McBride O W, Pollard H B, Burns A L. Biochemistry. 1994;33:6888–6901. - PubMed

Publication types