

Noninvasive functional optical spectroscopy of human breast tissue
- PMID: 11287650
- PMCID: PMC31850
- DOI: 10.1073/pnas.071511098
Noninvasive functional optical spectroscopy of human breast tissue
Abstract
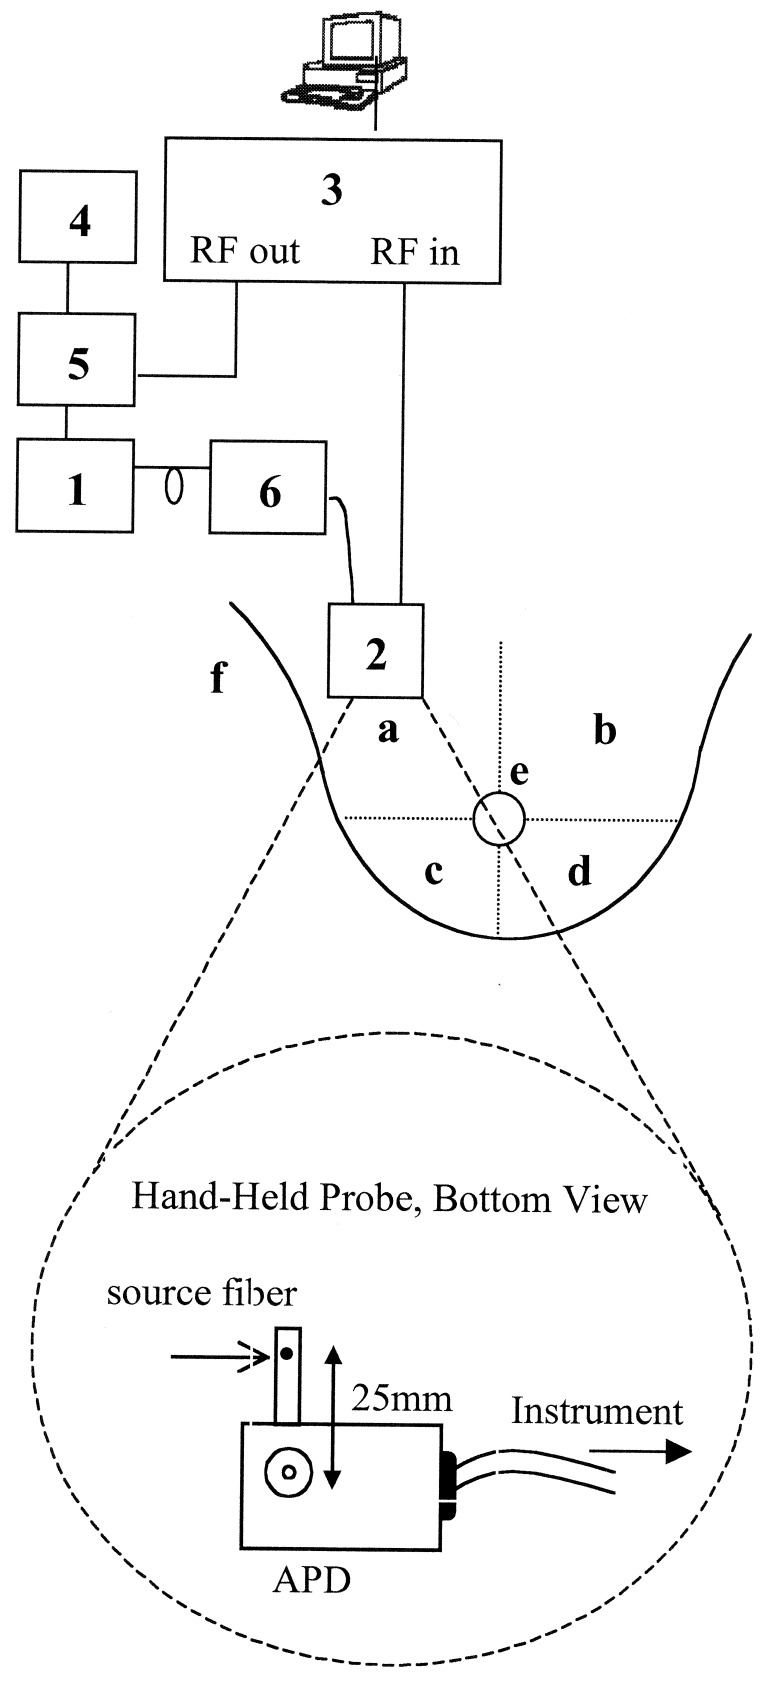
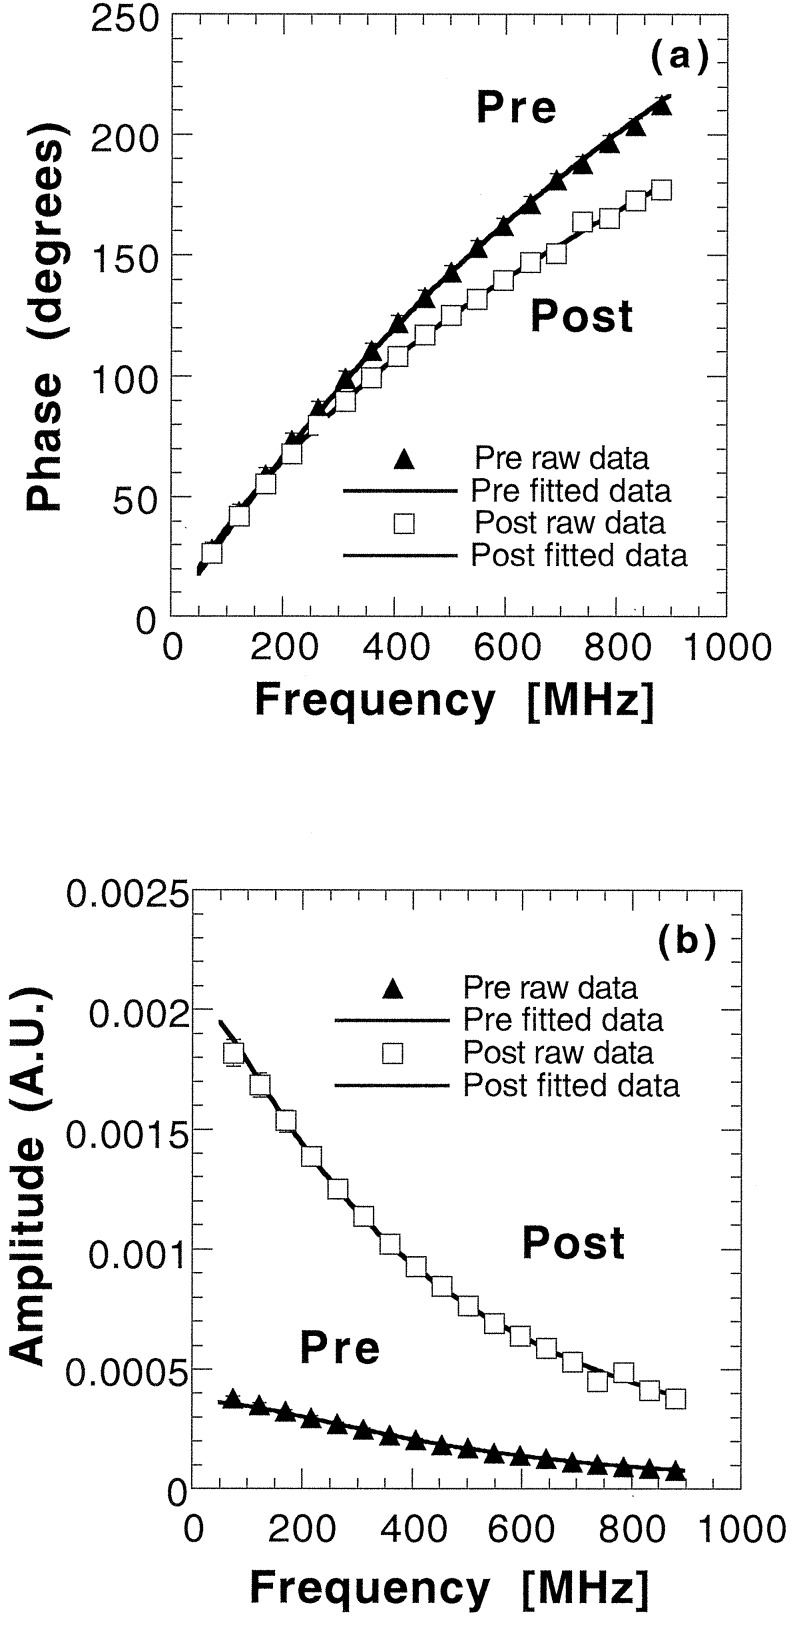
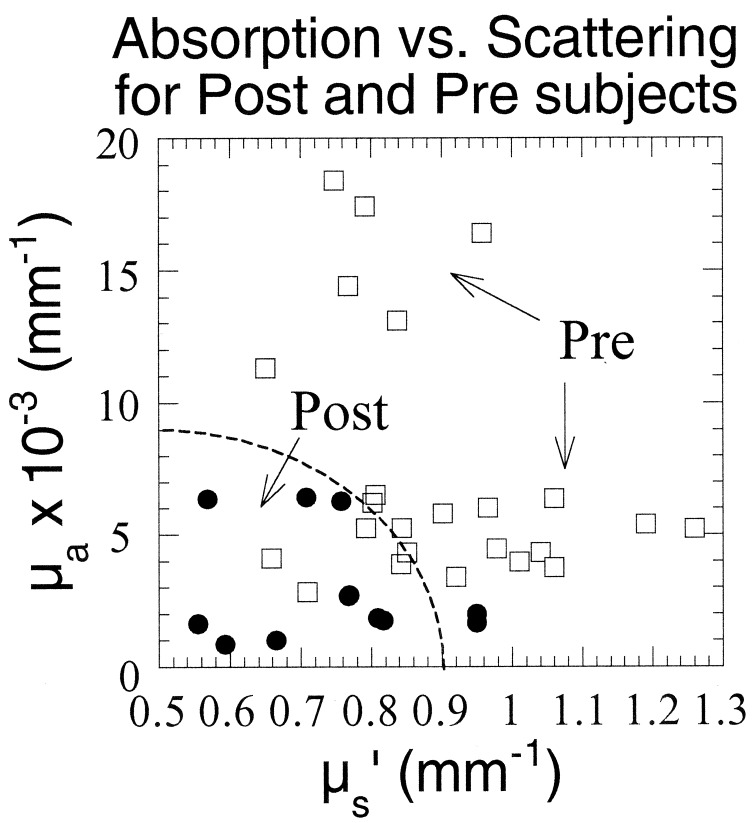
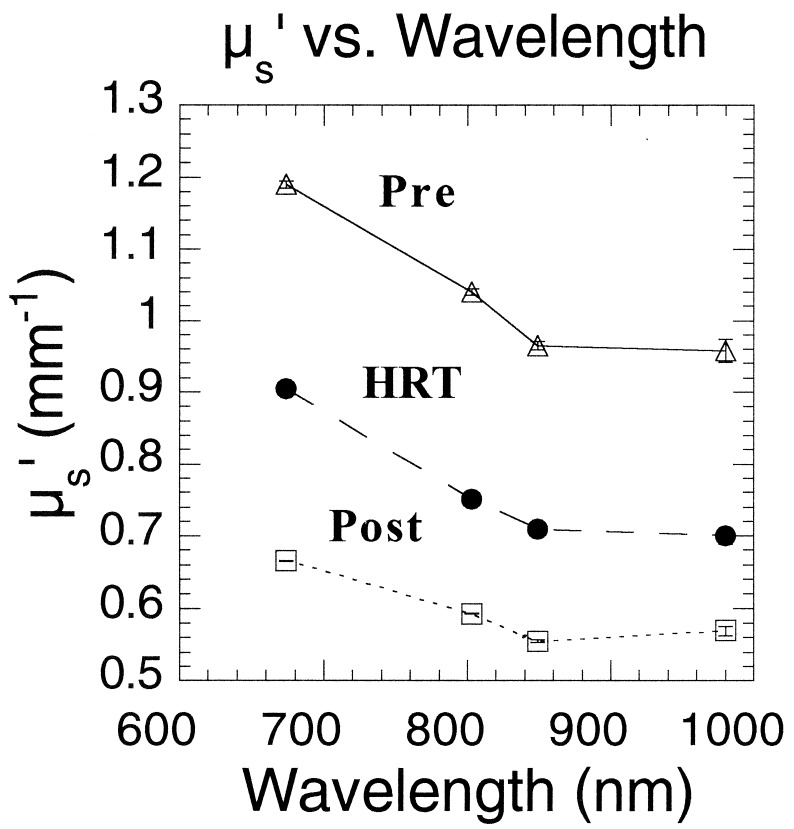
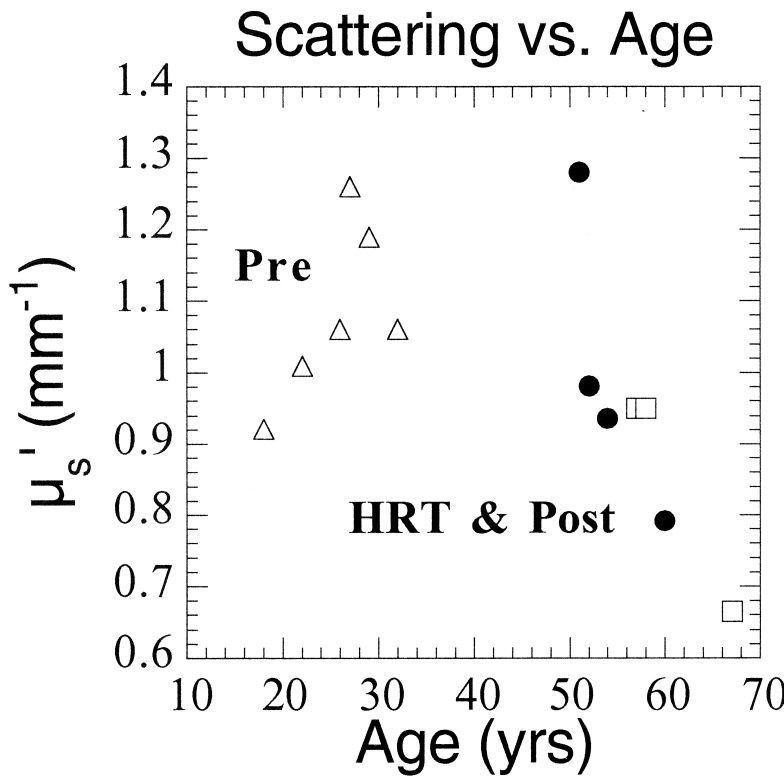
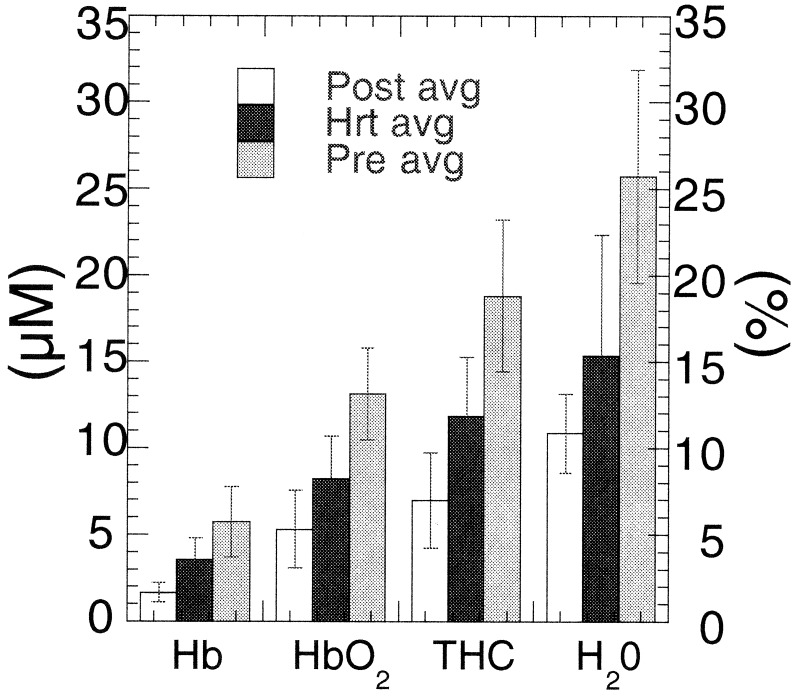
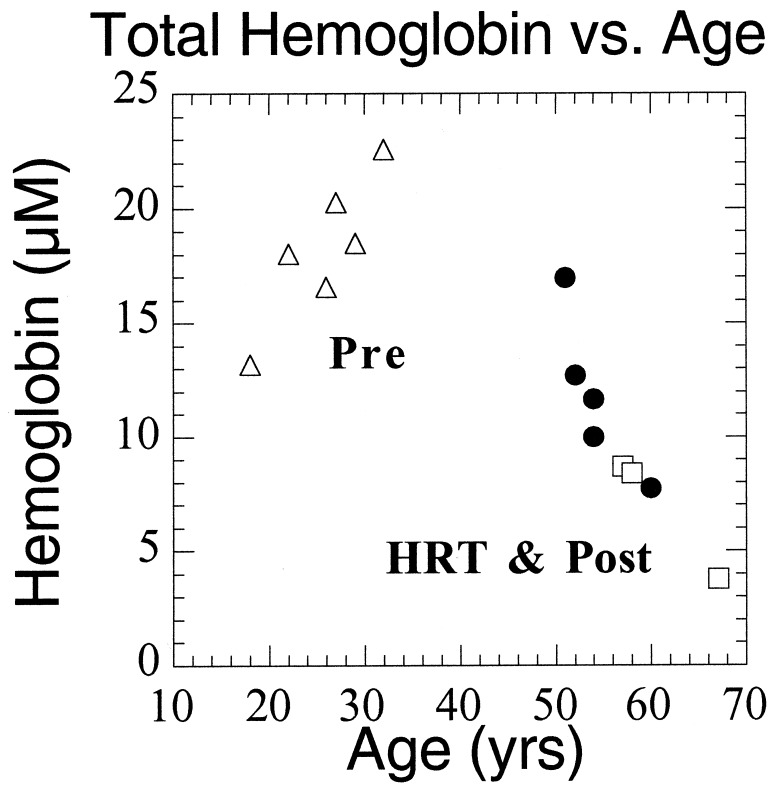
Near infrared diffuse optical spectroscopy and diffuse optical imaging are promising methods that eventually may enhance or replace existing technologies for breast cancer screening and diagnosis. These techniques are based on highly sensitive, quantitative measurements of optical and functional contrast between healthy and diseased tissue. In this study, we examine whether changes in breast physiology caused by exogenous hormones, aging, and fluctuations during the menstrual cycle result in significant alterations in breast tissue optical contrast. A noninvasive quantitative diffuse optical spectroscopy technique, frequency-domain photon migration, was used. Measurements were performed on 14 volunteer subjects by using a hand-held probe. Intrinsic tissue absorption and reduced scattering parameters were calculated from frequency-domain photon migration data. Wavelength-dependent absorption (at 674, 803, 849, and 956 nm) was used to determine tissue concentration of oxyhemoglobin, deoxyhemoglobin, total hemoglobin, tissue hemoglobin oxygen saturation, and bulk water content. Results show significant and dramatic differences in optical properties between menopausal states. Average premenopausal intrinsic tissue absorption and reduced scattering values at each wavelength are 2.5- to 3-fold higher and 16-28 % greater, respectively, than absorption and scattering for postmenopausal subjects. Absorption and scattering properties for women using hormone replacement therapy are intermediate between premenopausal and postmenopausal populations. Physiological properties show differences in mean total hemoglobin (7.0 microM, 11.8 microM, and 19.2 microM) and water concentration relative to pure water (10.9 %, 15.3 %, and 27.3 %) for postmenopausal, hormone replacement therapy, and premenopausal subjects, respectively. Because of their unique, quantitative information content, diffuse optical methods may play an important role in breast diagnostics and improving our understanding of breast disease.
Figures
References
-
- Kerlikowske K, Barclay J. J Natl Cancer Inst Monogr. 1997;22:105–110. - PubMed
-
- Elmore J G, Barton M B, Moceri V M, Polk S, Arena P J, Fletcher S W. N Engl J Med. 1998;338:1089–1096. - PubMed
-
- Hindle W H, Davis L, Wright D. Am J Obstet Gynecol. 1999;180:1484–1490. - PubMed
-
- Baines C J, Dayan R. J Natl Cancer Inst. 1999;91:833–838. - PubMed
-
- Laya M B, Larson E B, Taplin S H, White E. J Natl Cancer Inst. 1996;88:643–649. - PubMed
Publication types
MeSH terms
Grants and funding
LinkOut - more resources
Full Text Sources
Other Literature Sources
Medical
