. 2001 Apr 10;98(8):4563-8.
doi: 10.1073/pnas.081068098. Epub 2001 Apr 3.

Maximum likelihood estimation of a migration matrix and effective population sizes in n subpopulations by using a coalescent approach

Affiliations

Maximum likelihood estimation of a migration matrix and effective population sizes in n subpopulations by using a coalescent approach

P Beerli et al. Proc Natl Acad Sci U S A. .

Abstract

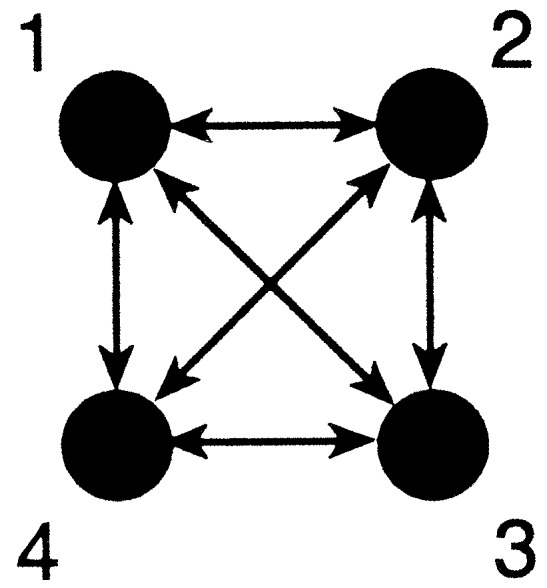
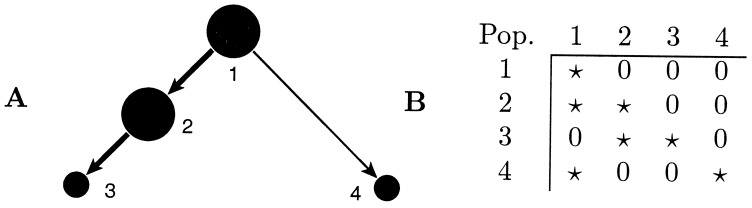
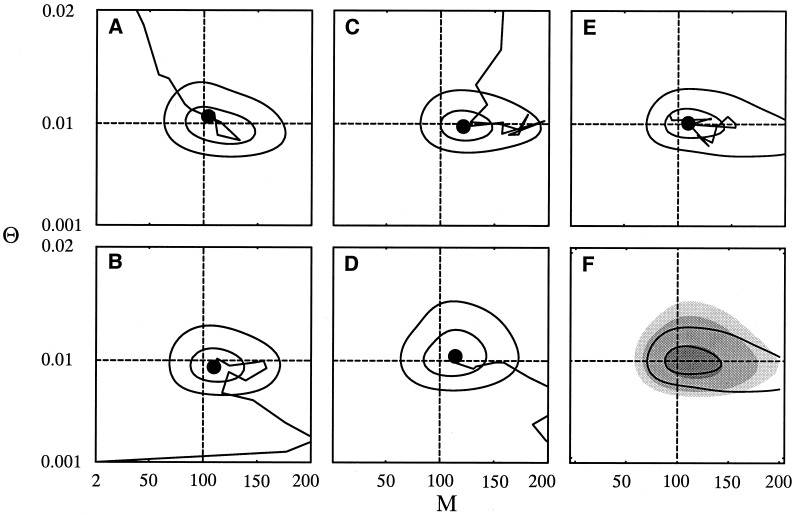
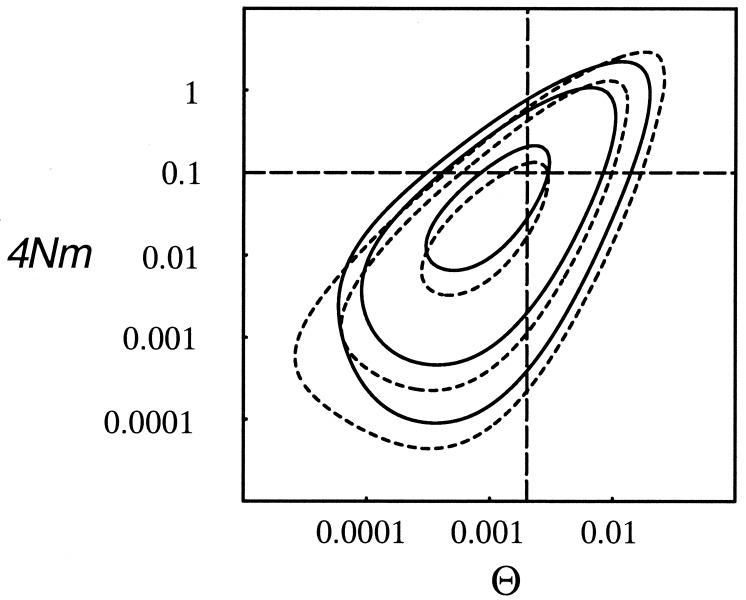
A maximum likelihood estimator based on the coalescent for unequal migration rates and different subpopulation sizes is developed. The method uses a Markov chain Monte Carlo approach to investigate possible genealogies with branch lengths and with migration events. Properties of the new method are shown by using simulated data from a four-population n-island model and a source-sink population model. Our estimation method as coded in migrate is tested against genetree; both programs deliver a very similar likelihood surface. The algorithm converges to the estimates fairly quickly, even when the Markov chain is started from unfavorable parameters. The method was used to estimate gene flow in the Nile valley by using mtDNA data from three human populations.


Figures

Figure 1
Figure 1
n-island model with four populations of equal size, exchanging migrants with equal rates.
Figure 2
Figure 2
A source–sink population complex. (A) Arrows mark directions of migration, and disk sizes are proportional to population sizes. (B) The corresponding population connection matrix used in migrate. The matrix contains specifications for Θ on the diagonal and for the off-diagonal. * indicates this parameter is estimated without restriction, and 0 indicates it is held to 0 so there is no direct gene flow between these subpopulations.
Figure 3
Figure 3
Convergence of parameter estimates in migrate. Four runs by using different initial parameter settings in migrate: (A) Θ0 = 0.1 and ℳ0 = 2, (B) 0.001 and 2, (C) 0.1 and 200, (D) 0.001 and 200. E shows run that was started with values from an FST-based method with Θ0 = 0.0097 and M0 = 97. F compares the average surface of A–D with E. In A–E, the line marks the trajectory of the parameter estimates over successive chains to the final estimate (black disk). Solid contour lines depict approximate 50 and 95% likelihood-based confidence regions. Gray-scale contour areas are from dark to light, 50, 95, 99% confidence regions of the average of A–D. The data set was generated by using Θ = 0.01 and M = 100 (dashed lines).
Figure 4
Figure 4
Comparison between results from migrate and genetree. The logarithm likelihood contours inferred by migrate are drawn with solid lines, and those inferred by genetree with broken lines. Contour lines enclose approximate 50, 95, and 99% likelihood-based confidence regions. The dashed lines mark the true parameter values used to generate the data set.

References

    1. Wright S. Genetics. 1952;37:312–321. - PMC - PubMed
    1. Hudson R R, Slatkin M, Maddison W P. Genetics. 1992;132:583–589. - PMC - PubMed
    1. Slatkin M. Genetics. 1993;139:457–462. - PMC - PubMed
    1. Excoffier L, Smouse P E. Genetics. 1994;136:343–359. - PMC - PubMed
    1. Weir B S. Genetic Data Analysis II. Sunderland, MA: Sinauer; 1996.

Publication types

LinkOut - more resources