

Down-regulation of glycosylphosphatidylinositol-specific phospholipase D induced by lipopolysaccharide and oxidative stress in the murine monocyte- macrophage cell line RAW 264.7
- PMID: 11292743
- PMCID: PMC98279
- DOI: 10.1128/IAI.69.5.3214-3223.2001
Down-regulation of glycosylphosphatidylinositol-specific phospholipase D induced by lipopolysaccharide and oxidative stress in the murine monocyte- macrophage cell line RAW 264.7
Abstract
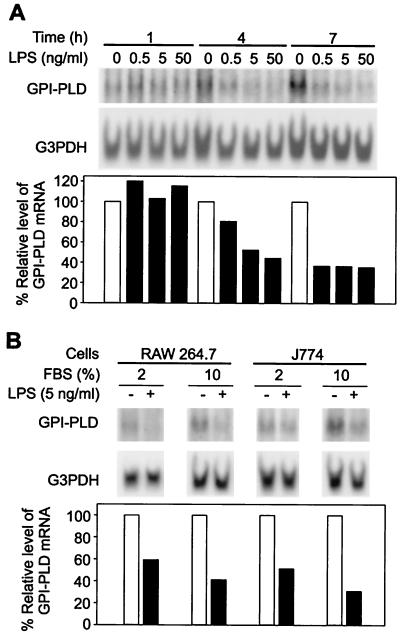
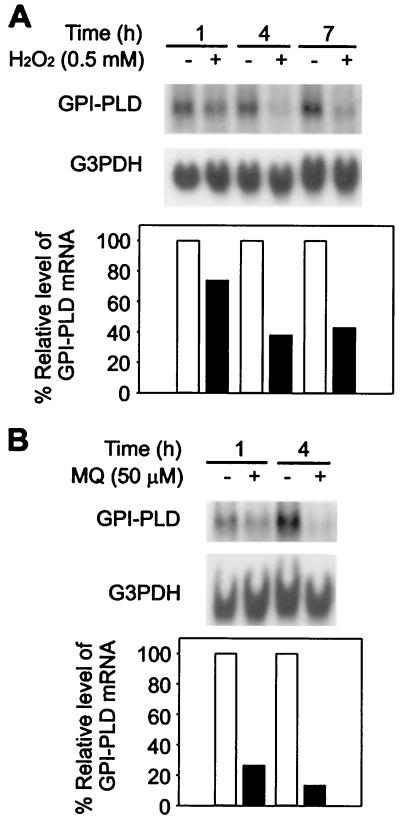
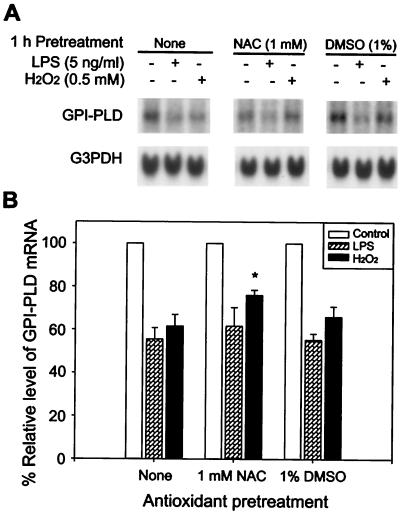
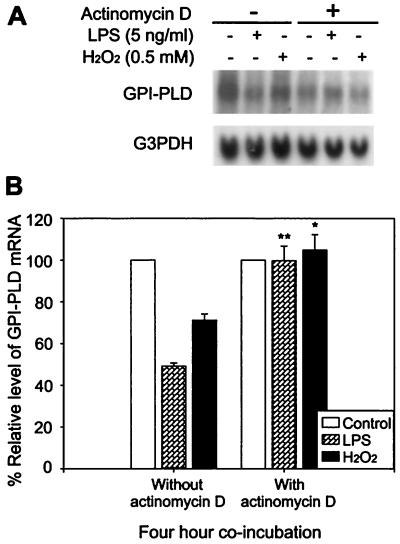
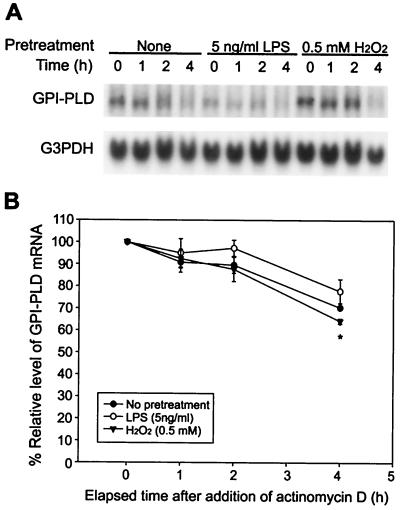
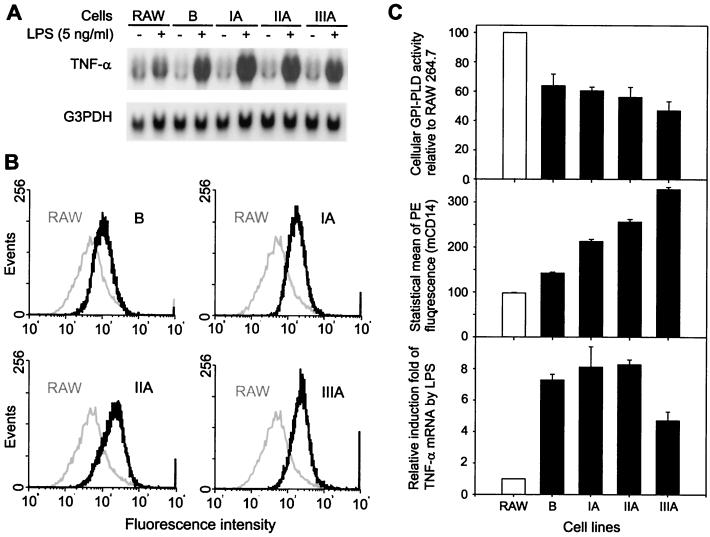
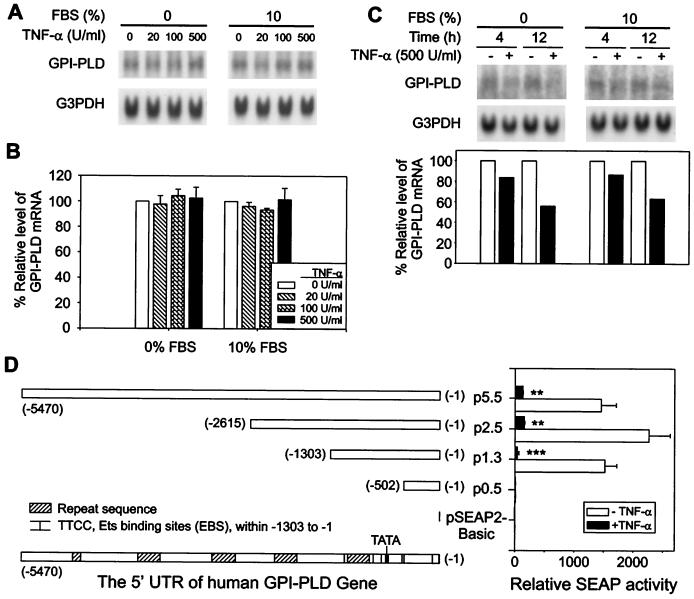
Serum glycosylphosphatidylinositol-specific phospholipase D (GPI-PLD) activity is reduced over 75% in systemic inflammatory response syndrome. To investigate the mechanism of this response, expression of the GPI-PLD gene was studied in the mouse monocyte-macrophage cell line RAW 264.7 stimulated with lipopolysaccharide (LPS; 0.5 to 50 ng/ml). GPI-PLD mRNA was reduced approximately 60% in a time- and dose-dependent manner. Oxidative stress induced by 0.5 mM H(2)O(2) or 50 microM menadione also caused a greater than 50% reduction in GPI-PLD mRNA. The antioxidant N-acetyl-L-cysteine attenuated the down-regulatory effect of H(2)O(2) but not of LPS. Cotreatment of the cells with actinomycin D inhibited down-regulation induced by either LPS or H(2)O(2). The half-life of GPI-PLD mRNA was not affected by LPS, or decreased slightly with H(2)O(2), indicating that the reduction in GPI-PLD mRNA is due primarily to transcriptional regulation. Stimulation with tumor necrosis factor alpha (TNF-alpha) resulted in approximately 40% reduction in GPI-PLD mRNA in human A549 alveolar carcinoma cells but not RAW 264.7 cells, suggesting that alternative pathways could exist in different cell types for down-regulating GPI-PLD expression during an inflammatory response and the TNF-alpha autocrine signaling mechanism alone is not sufficient to recapitulate the LPS-induced reduction of GPI-PLD in macrophages. Sublines of RAW 264.7 cells with reduced GPI-PLD expression exhibited increased cell sensitivity to LPS stimulation and membrane-anchored CD14 expression on the cell surface. Our data suggest that down-regulation of GPI-PLD could play an important role in the control of proinflammatory responses.
Figures
Similar articles
-
Glycosylphosphatidylinositol-specific phospholipase D is expressed by macrophages in human atherosclerosis and colocalizes with oxidation epitopes.Circulation. 1999 Jun 8;99(22):2876-82. doi: 10.1161/01.cir.99.22.2876. Circulation. 1999. PMID: 10359731
-
Phospholipase D1 is required for lipopolysaccharide-induced tumor necrosis factor-α expression and production through S6K1/JNK/c-Jun pathway in Raw 264.7 cells.Cytokine. 2014 Mar;66(1):69-77. doi: 10.1016/j.cyto.2013.12.018. Epub 2014 Jan 25. Cytokine. 2014. PMID: 24548427
-
Cellular glycosylphosphatidylinositol-specific phospholipase D regulates urokinase receptor shedding and cell surface expression.J Cell Physiol. 1999 Aug;180(2):225-35. doi: 10.1002/(SICI)1097-4652(199908)180:2<225::AID-JCP10>3.0.CO;2-2. J Cell Physiol. 1999. PMID: 10395292
-
Functional regulation of phospholipase D expression in cancer and inflammation.J Biol Chem. 2014 Aug 15;289(33):22575-22582. doi: 10.1074/jbc.R114.569822. Epub 2014 Jul 2. J Biol Chem. 2014. PMID: 24990948 Free PMC article. Review.
-
The role of GPLD1 in chronic diseases.J Cell Physiol. 2023 Jul;238(7):1407-1415. doi: 10.1002/jcp.31041. Epub 2023 Jul 2. J Cell Physiol. 2023. PMID: 37393554 Review.
Cited by
-
Expression of the mono-ADP-ribosyltransferase ART1 by tumor cells mediates immune resistance in non-small cell lung cancer.Sci Transl Med. 2022 Mar 16;14(636):eabe8195. doi: 10.1126/scitranslmed.abe8195. Epub 2022 Mar 16. Sci Transl Med. 2022. PMID: 35294260 Free PMC article.
-
Cysteine-less glycosylphosphatidylinositol-specific phospholipase C is inhibited competitively by a thiol reagent: evidence for glyco-mimicry by p-chloromercuriphenylsulphonate.Biochem J. 2002 Aug 15;366(Pt 1):281-8. doi: 10.1042/BJ20020367. Biochem J. 2002. PMID: 12010122 Free PMC article.
-
A novel role for the viral Rev protein in promoting resistance to superinfection by human immunodeficiency virus type 1.J Gen Virol. 2010 Jun;91(Pt 6):1503-13. doi: 10.1099/vir.0.019760-0. Epub 2010 Feb 10. J Gen Virol. 2010. PMID: 20147519 Free PMC article.
-
Tolerance of glycosylphosphatidylinositol (GPI)-specific phospholipase D overexpression by Chinese hamster ovary cell mutants with aberrant GPI biosynthesis.Biochem J. 2002 Jan 1;361(Pt 1):113-8. doi: 10.1042/0264-6021:3610113. Biochem J. 2002. PMID: 11742535 Free PMC article.
-
Phosphatidylinositol-glycan-phospholipase D is involved in neurodegeneration in prion disease.PLoS One. 2015 Apr 13;10(4):e0122120. doi: 10.1371/journal.pone.0122120. eCollection 2015. PLoS One. 2015. PMID: 25867459 Free PMC article.
References
-
- Antal-Szalmás P. Evaluation of CD14 in host defence. Eur J Clin Investig. 2000;30:167–179. - PubMed
-
- Beutler B. Tlr4: central component of the sole mammalian LPS sensor. Curr Opin Immunol. 2000;12:20–26. - PubMed
-
- Brunner G, Metz C N, Nguyen H, Gabrilove J, Patel S R, Davitz M A, Rifkin D B, Wilson E L. An endogenous glycosylphosphatidylinositol-specific phospholipase D releases basic fibroblast growth factor-heparan sulfate proteoglycan complexes from human bone marrow cultures. Blood. 1994;83:2115–2125. - PubMed
-
- Bufler P, Stiegler G, Schuchmann M, Hess S, Krüger C, Stelter F, Eckerskorn C, Schütt C, Engelmann H. Soluble lipopolysaccharide receptor (CD14) is released via two different mechanisms from human monocytes and CD14 transfectants. Eur J Immunol. 1995;25:604–610. - PubMed
-
- Deckert M, Ticchioni M, Mari B, Mary D, Bernard A. The glycosylphosphatidylinositol-anchored CD59 protein stimulates both T cell receptor zeta/ZAP-70-dependent and -independent signaling pathways in T cells. Eur J Immunol. 1995;25:1815–1822. - PubMed
Publication types
MeSH terms
Substances
Grants and funding
LinkOut - more resources
Full Text Sources
Other Literature Sources
Research Materials
