. 2001 Apr 15;29(8):1750-64.
doi: 10.1093/nar/29.8.1750.

PartsList: a web-based system for dynamically ranking protein folds based on disparate attributes, including whole-genome expression and interaction information

Affiliations

PartsList: a web-based system for dynamically ranking protein folds based on disparate attributes, including whole-genome expression and interaction information

J Qian et al. Nucleic Acids Res. .

Abstract

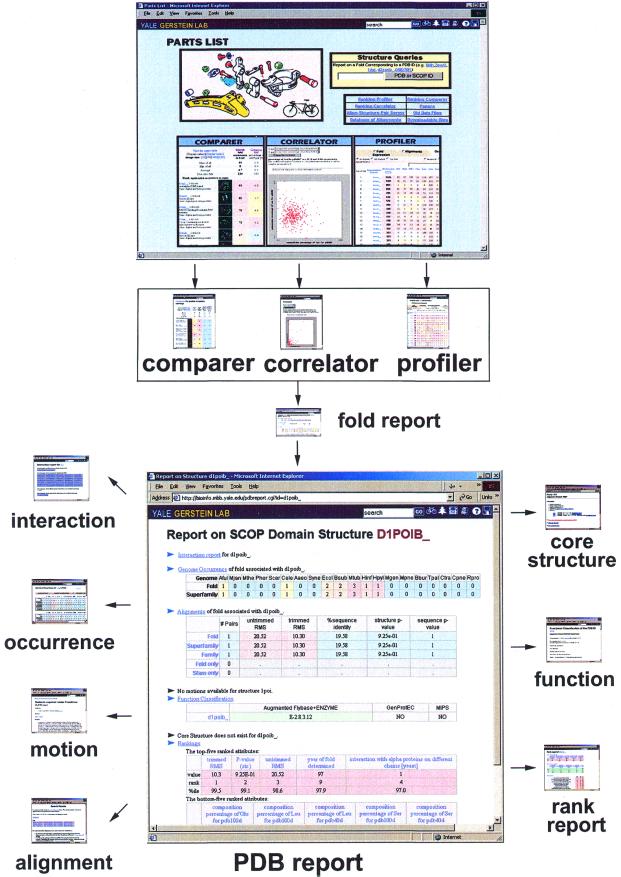
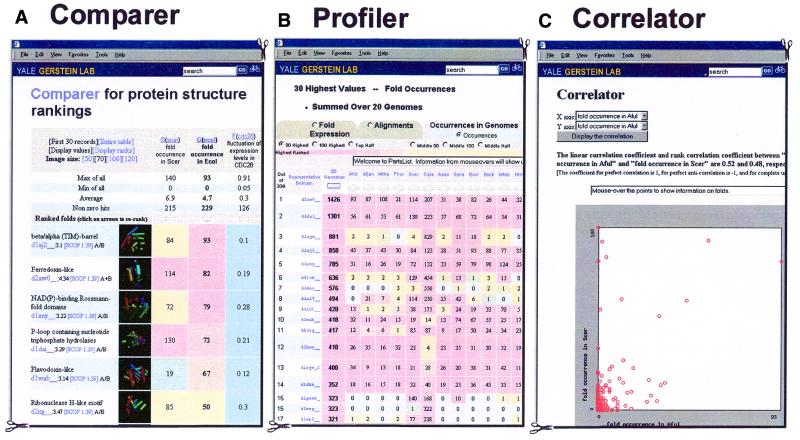
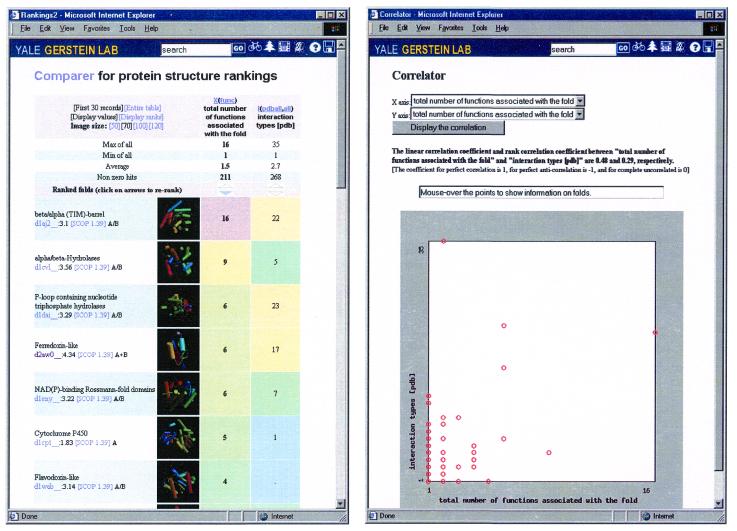
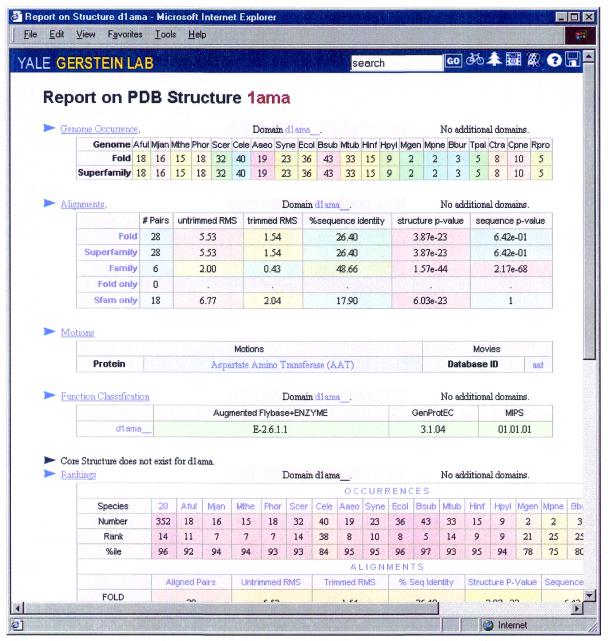
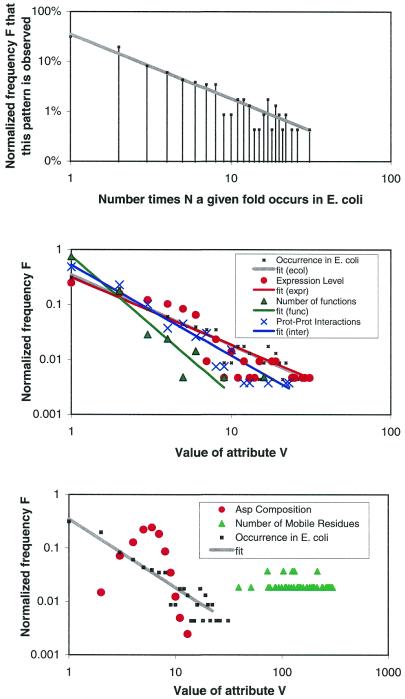
As the number of protein folds is quite limited, a mode of analysis that will be increasingly common in the future, especially with the advent of structural genomics, is to survey and re-survey the finite parts list of folds from an expanding number of perspectives. We have developed a new resource, called PartsList, that lets one dynamically perform these comparative fold surveys. It is available on the web at http://bioinfo.mbb.yale.edu/partslist and http://www.partslist.org. The system is based on the existing fold classifications and functions as a form of companion annotation for them, providing 'global views' of many already completed fold surveys. The central idea in the system is that of comparison through ranking; PartsList will rank the approximately 420 folds based on more than 180 attributes. These include: (i) occurrence in a number of completely sequenced genomes (e.g. it will show the most common folds in the worm versus yeast); (ii) occurrence in the structure databank (e.g. most common folds in the PDB); (iii) both absolute and relative gene expression information (e.g. most changing folds in expression over the cell cycle); (iv) protein-protein interactions, based on experimental data in yeast and comprehensive PDB surveys (e.g. most interacting fold); (v) sensitivity to inserted transposons; (vi) the number of functions associated with the fold (e.g. most multi-functional folds); (vii) amino acid composition (e.g. most Cys-rich folds); (viii) protein motions (e.g. most mobile folds); and (ix) the level of similarity based on a comprehensive set of structural alignments (e.g. most structurally variable folds). The integration of whole-genome expression and protein-protein interaction data with structural information is a particularly novel feature of our system. We provide three ways of visualizing the rankings: a profiler emphasizing the progression of high and low ranks across many pre-selected attributes, a dynamic comparer for custom comparisons and a numerical rankings correlator. These allow one to directly compare very different attributes of a fold (e.g. expression level, genome occurrence and maximum motion) in the uniform numerical format of ranks. This uniform framework, in turn, highlights the way that the frequency of many of the attributes falls off with approximate power-law behavior (i.e. according to V(-b), for attribute value V and constant exponent b), with a few folds having large values and most having small values.


Figures

Figure 1
Figure 1
The overall structure of PartsList. Three tools (Profiler, Comparer and Correlator) provide an easy way to access and manipulate the display of the dataset. With these tools, users can isolate interesting folds and obtain fold reports about them. Further clicks take one to PDB report, which gives detailed information about an individual structural domain, including its genome occurrence, alignment information, molecular motions, functional annotation, interactions and core structure.
Figure 2
Figure 2
Sample displays. (A) A sample Comparer display: the four selected attributes are the fold genome occurrence in yeast, the analogous quantity for E.coli, fluctuation of expression level for CDC28 synchronized yeast cell during the cell cycle, and the corresponding values for E.coli to heat shock. (Using the nomenclature in Table 1 these quantities are G(scer), G(ecol), F(cdc28) and F(heatec).) The folds are ranked in terms of fold occurrence in E.coli and the most common fold here is the TIM-barrel (represented by the SCOP domain d1aj2__). If one clicks the ‘Display ranks’ button, the values in the cells will be replaced by the ranks in their respective columns. By clicking the ‘re-rank’ arrows, one can also obtain other views by sorting on other attributes. (B) Shows the occurrences of folds in 20 genomes in Profiler. (C) Shows the correlation between the fold occurrences in the A.fulgidus and S.cerevisiae genomes [G(aful) and G(scer)]. Both linear and rank correlation coefficients are calculated. The linear correlation coefficient is defined as: R = [1/(N–1)]X·Y, where X and Y are two vectors with N elements. Each element of the X vector is normalized thus: Xi = (Xi′ – X)/σx, where X and σx are the average and standard deviation of the values of the original data vector X′, respectively. Y is normalized in a similar fashion. For two perfectly correlated datasets, R = 1, while for two completely uncorrelated datasets, R = 0. If we replace Xi by its rank among all the other Xi in the sample (i.e., 1,2,3 … N), then we get the rank correlation coefficient. A scatter plot is also shown to help in visualizing this correlation.
Figure 3
Figure 3
The relation between the number of functions associated with a protein fold and the number of distinct protein–protein interactions it has (based on a survey of the PDB databank). These are X(func) and I(pdball,none) using the nomenclature in Table 1. This relationship can be displayed both in Comparer (left) and Correlator (right).
Figure 4
Figure 4
A sample PDB report for structure 1AMA. The report summarizes the relevant information for this domain, including genome occurrences, alignment, motions, function classification, core structure and rankings. By clicking on the headers, one can get the detailed reports for these quantities.
Figure 5
Figure 5
Some novel relationships that are highlighted by the PartsList system. (Upper panel) The occurrence of folds in the E.coli genome plotted on a log–log scale, i.e. G(ecol) using the nomenclature in Table 1. The x-axis is the fold occurrence in the genome, while the y-axis is the number of folds with a particular occurrence. The fit of the points to a straight line shows that the falloff obeys a power-law with constants a = 0.35 and b = 1.3 (see text). (Middle panel) Other attributes that also follow power-law behavior: the average expression level according to our merged and scaled set [L(ref) with a = 0.3 and b = 1.2), the number of protein–protein interactions [I(pdball,none) with a = 0.52 and b = 1.6], and the number of functions [X(func) with a = 0.76 and b = 2.5]. (Lower panel) Some attributes that do not follow power-law behavior: the Asp composition of the fold [B(Ala,pdb100)] and the number of mobile residues during a motion [M(nresidue,auto)]. The fold occurrence in E.coli is plotted as a reference.

References

    1. Chothia C. (1992) Proteins. One thousand families for the molecular biologist. Nature, 357, 543–544. - PubMed
    1. Brenner S.E., Hubbard,T., Murzin,A. and Chothia,C. (1995) Gene duplications in H. influenzae. Nature, 378, 140. - PubMed
    1. Wolf Y.I., Grishin,N.V. and Koonin,E.V. (2000) Estimating the number of protein folds and families from complete genome data. J. Mol. Biol., 299, 897–905. - PubMed
    1. The C. elegans Sequencing Consortium (1998) Genome sequence of the nematode C. elegans: a platform for investigating biology. Science, 282, 2012–2018. - PubMed
    1. Berman H.,M., Westbrook,J., Feng,Z., Gilliland,G., Bhat,T.N., Weissig,H., Shindyalov,I.N. and Bourne,P.E. (2000) The Protein Data Bank. Nucleic Acids Res., 28, 235–242. - PMC - PubMed

Publication types