. 2001 Apr;12(4):1103-16.
doi: 10.1091/mbc.12.4.1103.

Changes in organization of the endoplasmic reticulum during Xenopus oocyte maturation and activation

Affiliations
Free PMC article

Changes in organization of the endoplasmic reticulum during Xenopus oocyte maturation and activation

M Terasaki et al. Mol Biol Cell. 2001 Apr.
Free PMC article

Abstract

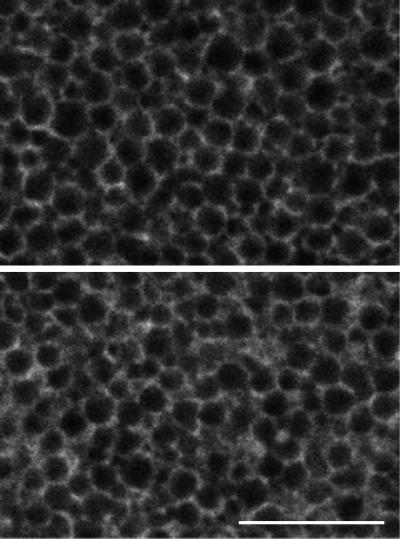
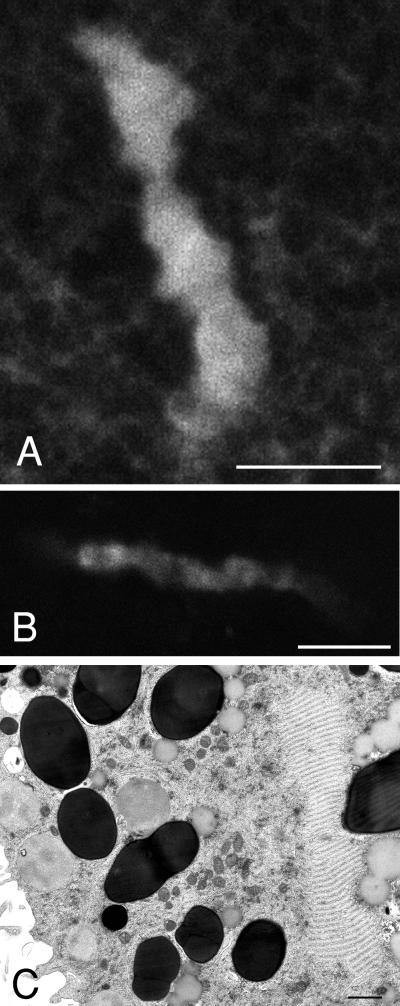
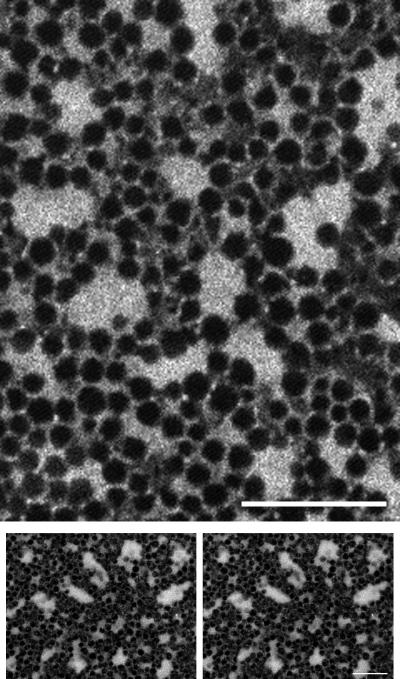
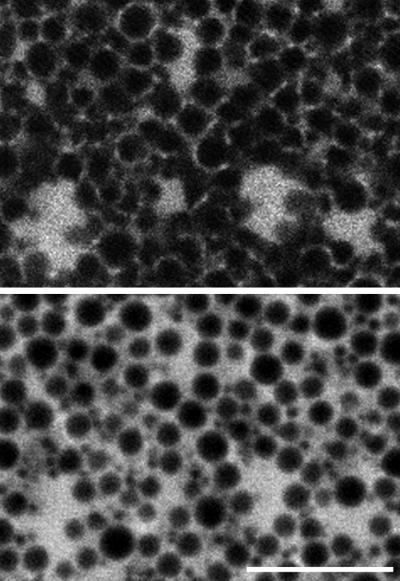
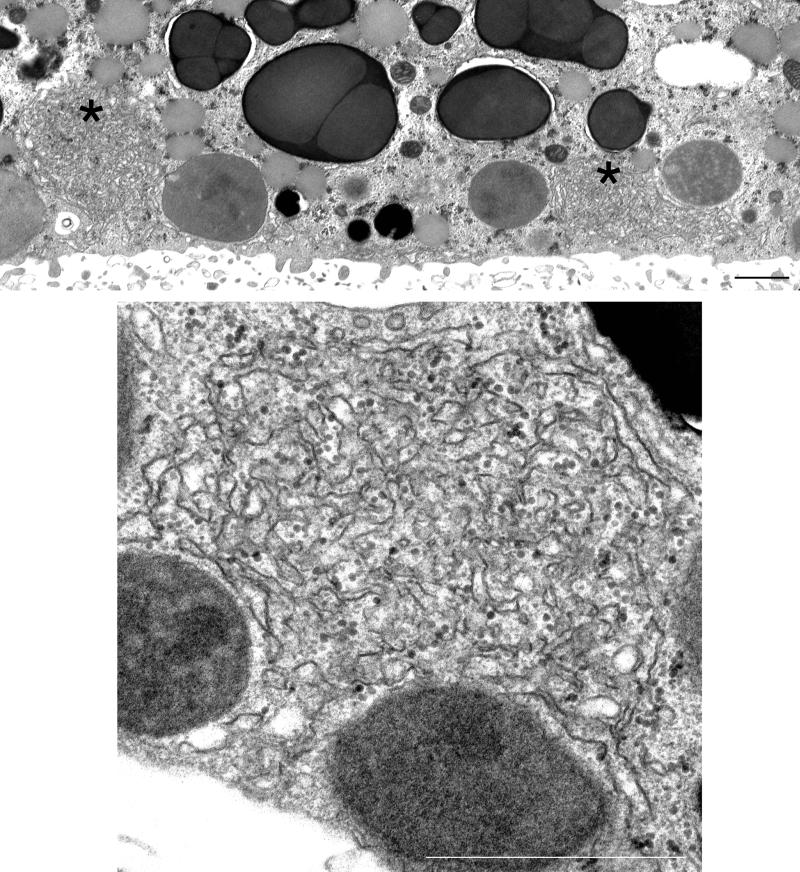
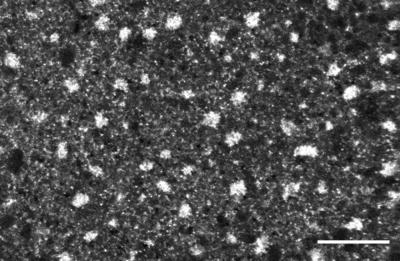
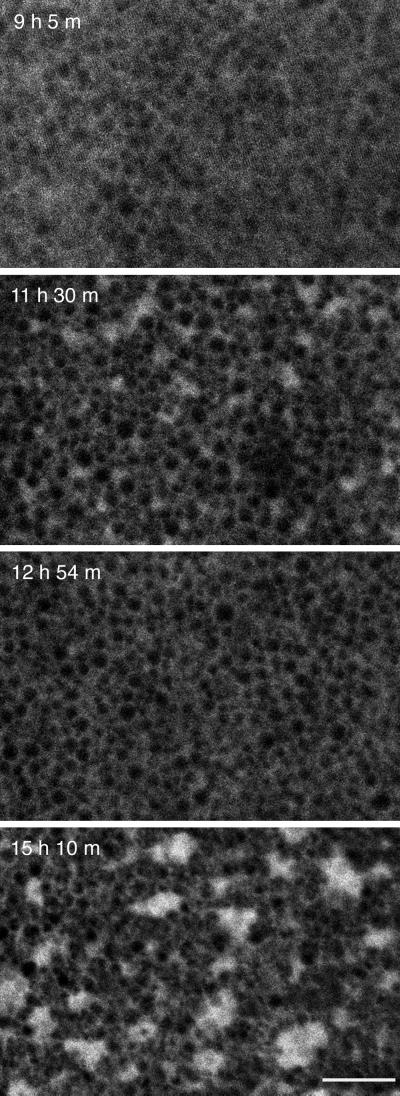
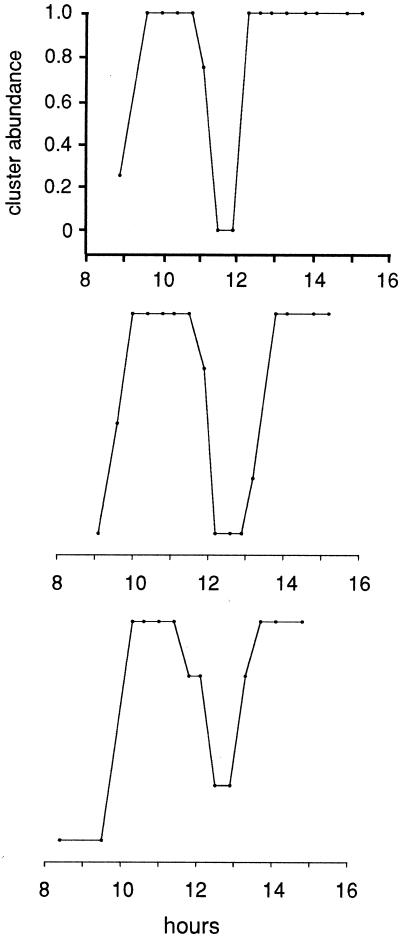
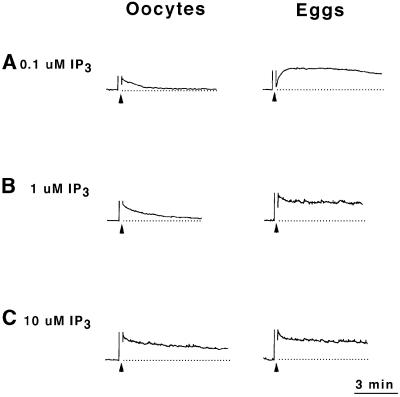
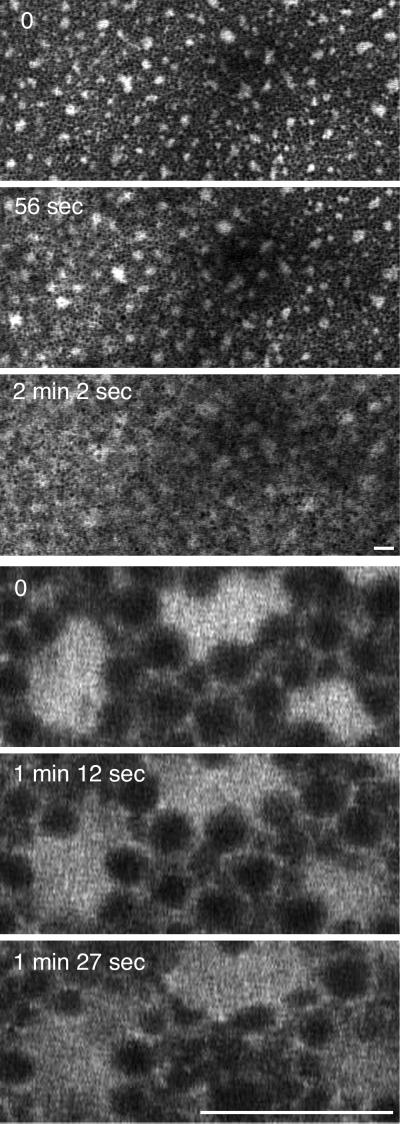
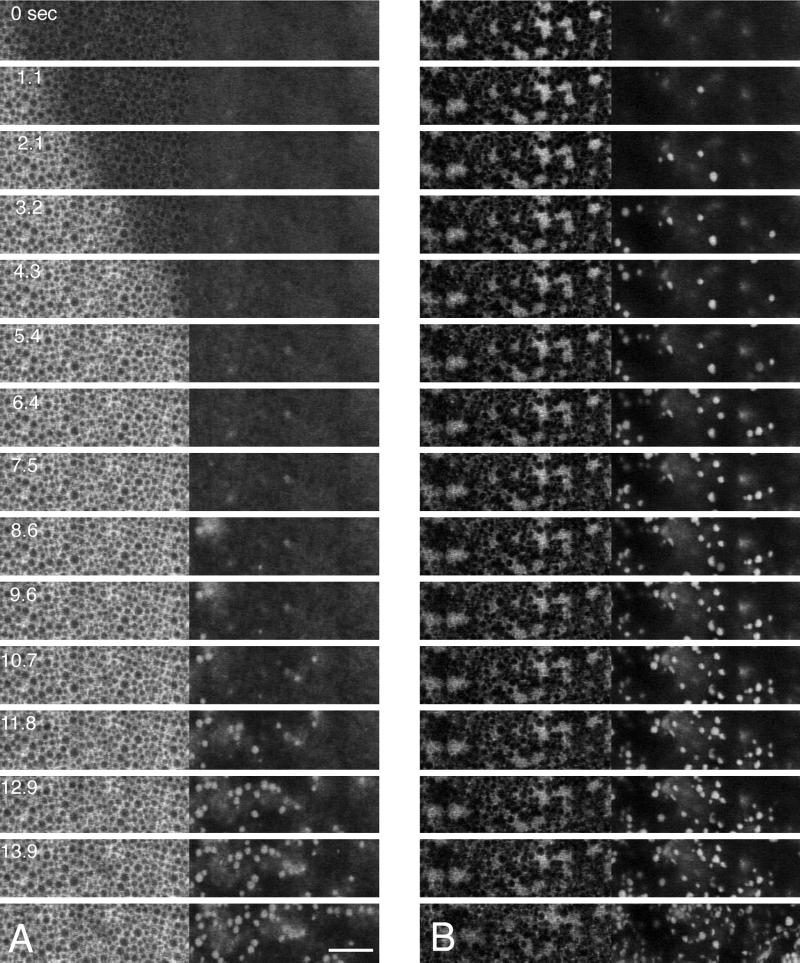
The organization of the endoplasmic reticulum (ER) in the cortex of Xenopus oocytes was investigated during maturation and activation using a green fluorescent protein chimera, immunofluorescence, and electron microscopy. Dense clusters of ER developed on the vegetal side (the side opposite the meiotic spindle) during maturation. Small clusters appeared transiently at the time of nuclear envelope breakdown, disappeared at the time of first polar body formation, and then reappeared as larger clusters in mature eggs. The appearance of the large ER clusters was correlated with an increase in releasability of Ca(2+) by IP(3). The clusters dispersed during the Ca(2+) wave at activation. Possible relationships of ER structure and Ca(2+) regulation are discussed.


Figures

Figure 1
Figure 1
High-magnification view of GFP–KDEL labeling in the cortex of immature oocytes. The top panel shows labeling in the animal half, and the bottom panel shows labeling in the vegetal half. On both sides, the ER has a network appearance, probably consisting of tubules and/or single (unstacked) cisternae. The pattern on the vegetal side has a small amount of patches. Cortical granules and other organelles are present in the dark spaces between the ER. Bar, 10 μm.
Figure 2
Figure 2
Annulate lamellae in the vegetal half of immature oocytes. (A) An example of a long, dense island of GFP–KDEL labeling. These are present ∼5 μm in from the surface. Bar, 10 μm. (B) Immunofluorescence labeling with mAb 414 antibody to nuclear pores showing a similar structure as seen with GFP–KDEL labeling. Bar, 10 μm. (C) Thin-section electron micrograph in the vegetal cortex showing a long, narrow structure on the right side with the characteristic appearance of an annulate lamellae. The long, dense islands labeled by GFP–KDEL therefore correspond to annulate lamellae. Bar, 1 μm.
Figure 3
Figure 3
High-magnification view of GFP–KDEL labeling in the vegetal cortex of mature oocytes. Clusters of dense GFP–KDEL labeling have appeared during maturation. Bottom panels, stereo pair showing that the clusters extend into the cytoplasm. Bar, 10 μm.
Figure 4
Figure 4
Double labeling of GFP–KDEL (top panel) and cytosolic 3-kDa rhodamine dextran (bottom panel) in the vegetal cortex of mature oocytes. The cytosolic dextran penetrates into the cluster regions labeled by the GFP–KDEL. This indicates that the cluster is not a single swollen ER cisternae. This conclusion is consistent with the electron micrographs of ER clusters in Figure 5. The cortical granules and other large organelles in the cortex are seen in negative image in the dextran image, and the ER network outside the clusters is seen to run between these organelles. Bar, 10 μm.
Figure 5
Figure 5
Thin-section electron micrographs of ER clusters in the vegetal cortex of a mature oocyte. The top panel shows a low magnification view with two clusters that are denoted by black asterisks. The bottom panel is a high-magnification view of a cluster. The cluster consists of smooth-surfaced tubules and/or cisternae in a complicated three-dimensional arrangement. Bars, 10 μm.
Figure 6
Figure 6
Immunofluorescence with antibody to IP3 receptor in the vegetal half of a mature oocyte. The labeling shows a similarity to GFP–KDEL labeling of clusters. This indicates that IP3 receptors are present in the clusters and that the clusters are likely to be sites of Ca2+ release at fertilization. Bar, 10 μm.
Figure 7
Figure 7
Time course of the appearance of the GFP–KDEL-labeled clusters in the vegetal cortex during maturation. In this experiment, several oocytes were kept in individual dishes; at the various time points, individual oocytes were transferred to the microscope stage for imaging. The images shown were from the same oocyte. The time after addition of progesterone is indicated on the panels. The appearance of the white spot, caused by GVBD, was clearly seen in this oocyte first at 11 h. The image sequence shows the appearance of small clusters at around the time of GVBD, their disappearance at an intermediate time, and then the appearance of large clusters after the egg has become mature. Bar, 10 μm. Each graph shows the time course of the abundance of clusters for three different oocytes during maturation. Cluster abundance was scored visually on a scale between no clusters (0) and maximum number of clusters (1.0). The x-axis shows time after addition of progesterone. The graphs for the different oocytes were positioned so that the decrease in clusters is lined up. The middle panel corresponds to the image sequence.
Figure 7
Figure 7
Time course of the appearance of the GFP–KDEL-labeled clusters in the vegetal cortex during maturation. In this experiment, several oocytes were kept in individual dishes; at the various time points, individual oocytes were transferred to the microscope stage for imaging. The images shown were from the same oocyte. The time after addition of progesterone is indicated on the panels. The appearance of the white spot, caused by GVBD, was clearly seen in this oocyte first at 11 h. The image sequence shows the appearance of small clusters at around the time of GVBD, their disappearance at an intermediate time, and then the appearance of large clusters after the egg has become mature. Bar, 10 μm. Each graph shows the time course of the abundance of clusters for three different oocytes during maturation. Cluster abundance was scored visually on a scale between no clusters (0) and maximum number of clusters (1.0). The x-axis shows time after addition of progesterone. The graphs for the different oocytes were positioned so that the decrease in clusters is lined up. The middle panel corresponds to the image sequence.
Figure 8
Figure 8
Oocytes are less sensitive to IP3 than mature eggs. Stage VI oocytes were coinjected with 20 μM Ca2+ green dextran and the indicated concentration of caged IP3. Some of these oocytes were matured in progesterone. During the 15-s period indicated by the arrowhead, the immature oocyte or mature egg (3 h after GVBD) was exposed to UV light to activate the caged IP3. Traces show Ca2+ green fluorescence as a function of time for caged IP3 at 0.1, 1.0, and 10 μM. The dotted line represents an extension of the baseline. Quantitation of these experiments is shown in Table 1.
Figure 9
Figure 9
Dispersal of GFP–KDEL-labeled ER clusters in the vegetal cortex during artificial activation. The egg was prick activated with a micro-needle, and then the egg was repositioned so that the vegetal cortex could be observed. The Ca2+ wave that is initiated by the prick activation takes 1–2 min to reach the region that is imaged. These two image sequences show the change in ER structure that occurs. The top three panels are a low-magnification sequence, and the bottom three panels show a higher-magnification view. Bars, 10 μm.
Figure 10
Figure 10
Relationship of the ER change at activation to surface changes. (A) Double labeling with intracellular Ca green dextran (left panels) and extracellular 3-kDa rhodamine dextran (right panels). In sea urchin eggs, extracellular dextrans label exocytotic pits that result from fusion of the cortical granules (Terasaki, 1995); it appears that extracellular dextran labels frog eggs similarly. Time interval between frames is 1.07 s. The increase in Ca2+ precedes the first appearance of extracellular dextran-labeled spots by 5–7 s. (B) Double labeling with GFP–KDEL (left panels) and extracellular rhodamine dextran (right panels). Changes in the ER seem to start to occur after or at the same time as the first appearance of extracellular dextran-labeled spots. Because the Ca2+ rise precedes the extracellular dextran-labeled spots, this indicates that the changes in the ER begin to occur ∼5–7 s after the release of Ca2+. Bar, 10 μm.

Similar articles

Cited by

References

    1. Campanella C, Andreuccetti P. Ultrastructural observations on cortical endoplasmic reticulum and on residual cortical granules in the egg of Xenopus laevis. Dev Biol. 1977;56:1–10. - PubMed
    1. Campanella C, Andreuccetti P, Taddei C, Talevi R. The modifications of cortical endoplasmic reticulum during in vitro maturation of Xenopus laevis oocytes and its involvement in cortical granule exocytosis. J Exp Zool. 1984;229:283–293. - PubMed
    1. Carroll DJ, Albay DT, Terasaki M, Jaffe LA, Foltz KR. Identification of PLCgamma-dependent and -independent events during fertilization of sea urchin eggs. Dev Biol. 1999;206:232–247. - PubMed
    1. Carroll DJ, Ramarao CS, Mehlmann LM, Roche S, Terasaki M, Jaffe LA. Calcium release at fertilization is mediated by phospholipase Cγ. J Cell Biol. 1997;138:1303–1311. - PMC - PubMed
    1. Carroll J. Na+ – Ca2+ exchange in mouse oocytes: modifications in the regulation of intracellular free Ca2+ during oocyte maturation. J Reprod Fertil. 2000;118:337–342. - PubMed

Publication types

Substances

LinkOut - more resources