. 2001 Apr 17;20(8):1863-74.
doi: 10.1093/emboj/20.8.1863.

Perinuclear, perigranular and sub-plasmalemmal mitochondria have distinct functions in the regulation of cellular calcium transport

Affiliations

Perinuclear, perigranular and sub-plasmalemmal mitochondria have distinct functions in the regulation of cellular calcium transport

M K Park et al. EMBO J. .

Abstract

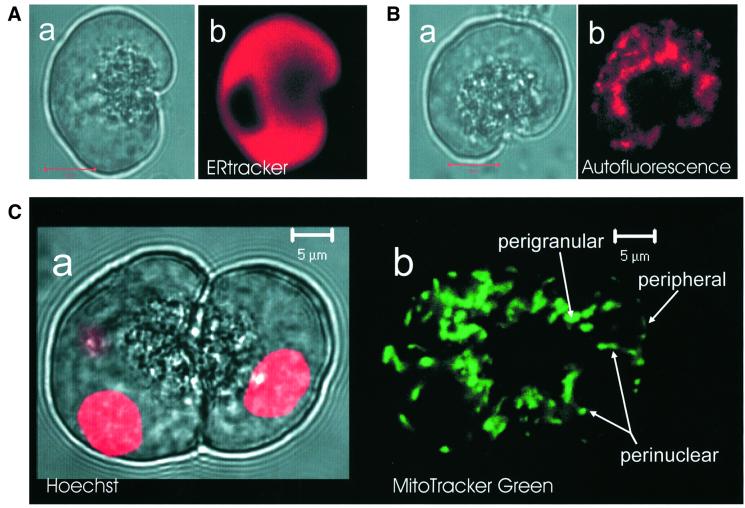
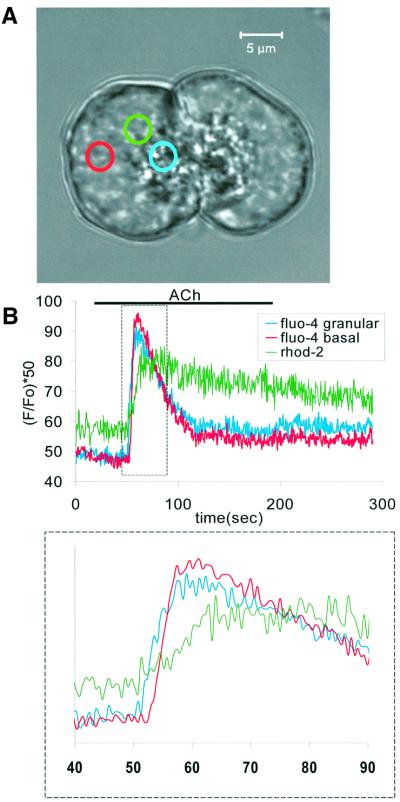
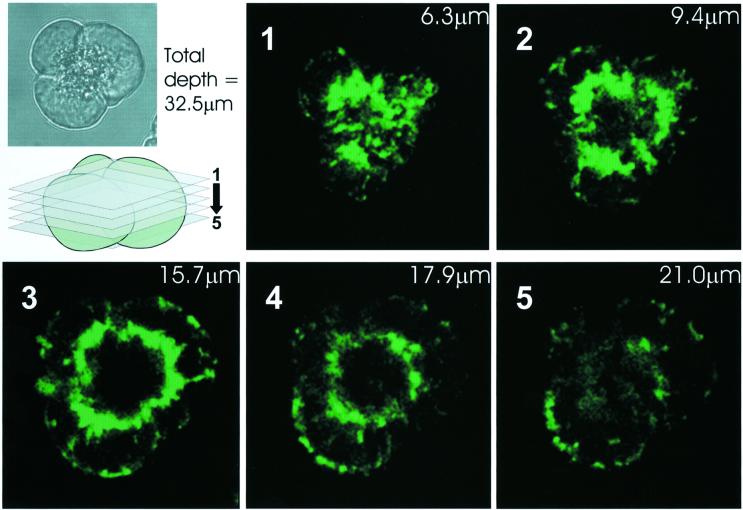
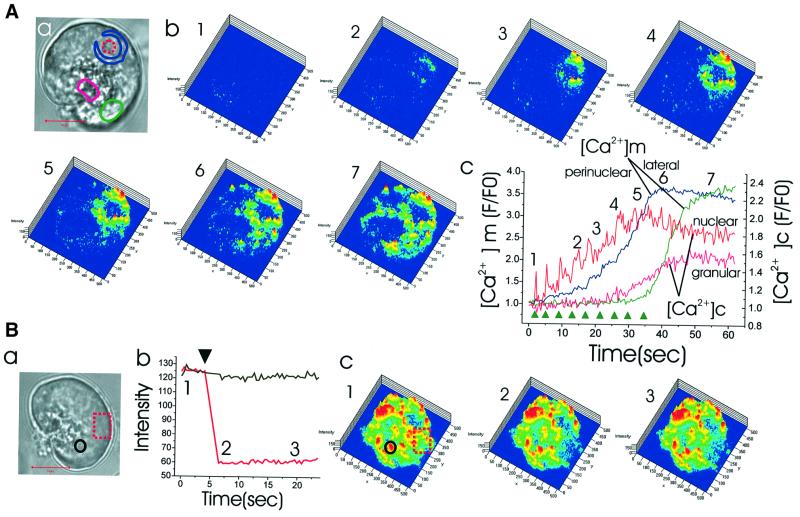
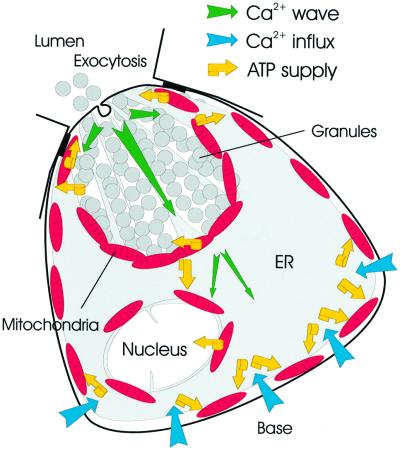
We have identified three distinct groups of mitochondria in normal living pancreatic acinar cells, located (i) in the peripheral basolateral region close to the plasma membrane, (ii) around the nucleus and (iii) in the periphery of the granular region separating the granules from the basolateral area. Three-dimensional reconstruction of confocal slices showed that the perigranular mitochondria form a barrier surrounding the whole of the granular region. Cytosolic Ca(2+) oscillations initiated in the granular area triggered mitochondrial Ca(2+) uptake mainly in the perigranular area. The most intensive uptake occurred in the mitochondria close to the apical plasma membrane. Store-operated Ca(2+) influx through the basolateral membrane caused preferential Ca(2+) uptake into sub-plasmalemmal mitochondria. The perinuclear mitochondria were activated specifically by local uncaging of Ca(2+) in the nucleus. These mitochondria could isolate nuclear and cytosolic Ca(2+) signalling. Photobleaching experiments indicated that different groups of mitochondria were not luminally connected. The three mitochondrial groups are activated independently by specific spatiotemporal patterns of cytosolic Ca(2+) signals and can therefore participate in the local regulation of Ca(2+) homeostasis and energy supply.


Figures

None
Fig. 1. Localization of endoplasmic reticulum (ER), nuclei and mitochondria in living pancreatic acinar cells. (A) Endoplasmic reticulum. The transmitted light picture of a single isolated acinar cell is shown in (a). In (b), the fluorescence image obtained with ERtracker is shown. The ER is densely packed outside the granular and nuclear areas. (B) Mitochondria. Transmitted light picture in (a) and autofluorescence (NADH) image in (b). The mitochondria are localized principally as a belt surrounding the granular region and as a peripheral ring just under the plasma membrane. Lengths of red bars in (A, a) and (B, a) represent 10 µm. (C) Nuclei and mitochondria. (a) Transmitted light picture showing the typical structure of two connected acinar cells with the secretory (zymogen) granules in the central part surrounding what in the intact organ would be the lumen. The nuclei are stained red with Hoechst 33342 and the fluorescence image is superimposed on the transmitted light picture. In the cell on the left, the focal plane goes through one nucleus, but it is just possible to detect the presence of a second nucleus. (b) MitoTracker Green fluorescence image. The strongest staining is localized as a ring surrounding the granular area, with some staining at the periphery as well as around the three nuclei (two in the left and one in the right cell). The mitochondria surrounding the nuclei seem to be aligned along the surfaces of these organelles.
None
Fig. 2. Mitochondrial Ca2+ uptake, measured with Rhod-2, following maximal ACh (10 µM)-elicited Ca2+ release from the endoplasmic reticulum. (A) Transmitted light picture showing the cell under investigation, with the three areas of interest identified by the three coloured circles. The length of the red bar represents 10 µm. (B) Autofluorescence image showing mitochondrial localization. (C) Six images showing mitochondrial Ca2+ concentration. Image 1 shows the situation just before the start of stimulation. Image 2 shows that immediately after ACh application, there was Ca2+ uptake into mitochondria very close to the apical membrane. A little later, the whole perigranular mitochondrial belt was revealed (images 3 and 4) and finally (images 5 and 6) all mitochondria in the cell had taken up Ca2+. (D) The time course of the mitochondrial Ca2+ uptake in the three regions identified in (A) using the appropriate colour coding. The main part of the figure represents a short time segment of the more complete traces shown in the inset. The time scale relates to the expanded traces labeled with the numbers 1–6, corresponding to the images in (C).
None
Fig. 3. Simultaneous measurements of cytosolic (fluo-4) and mitochondrial (Rhod-2) Ca2+ concentration changes after ACh stimulation. (A) The transmitted light picture shows the structure of the acinar doublet with the three colour-coded circles indicating the regions of interest. (B) The time courses of the ACh-elicited changes in the cytosolic Ca2+ concentrations in the granular (blue) and basal (red) regions, as well as the mitochondrial Ca2+ concentration in the perigranular region (green). In the inset below, showing the initial part of the three curves on an expanded time scale, it is seen that the mitochondrial Ca2+ uptake started immediately after the initial rise in the cytosolic Ca2+ concentration in the granular area.
None
Fig. 4. Simultaneous measurements of the ACh-elicted Ca2+ concentration changes in the ER and the mitochondria. (A) Images from a single cell. (a) Rhod-2 fluorescence images taken at 132.6 s intervals showing the accumulation and subsequent loss of Ca2+ from the mitochondria following a short period of ACh stimulation. The first image was obtained just before the start of stimulation with ACh. (b) Mag-fluo-4 fluorescence images showing the gradual loss of Ca2+ from the ER in response to ACh stimulation and the subsequent re-accumulation. The first image was taken just before the start of stimulation. The interval between images was 132.6 s. (B) Time course of ACh-elicited changes in the Ca2+ concentrations in the mitochondria (Rhod-2, red), the ER (Mag-fluo-4, blue) and the cytosol (whole-cell Ca2+-dependent current, black).
None
Fig. 5. Region-specific mitochondrial Ca2+ uptake following cytosolic Ca2+ oscillations. The coloured traces in the main panel show the time courses of the Ca2+ concentration changes in mitochondria localized as shown in the transmitted light image. The colour coding of the traces corresponds to the coloured circles in the transmitted light picture. The length of the red bar in the transmitted light picture corresponds to 10 µm. The black trace in the main panel represents the Ca2+-dependent whole-cell current, which shows the time course of the changes in the cytosolic Ca2+ concentration. Stimulation with a low ACh concentration elicited repetitive cytosolic Ca2+ spikes. The Rhod-2 fluorescence images taken before, during and after the first ACh-elicited cytosolic Ca2+ spike (images 1–3) show that the main mitochondrial Ca2+ uptake during this spike occurred in the perigranular region. Since the release of Ca2+ taken up into the mitochondria is relatively slow, the mitochondria did not liberate all the Ca2+ accumulated during a single spike before the next spike occurred. Therefore, during this experiment, Ca2+ accumulated gradually in the mitochondria. In relation to the last spike in the series, the corresponding Rhod-2 fluorescence images are shown (images 4–6). It can be seen that even before the spike started there was considerable fluorescence both from the most apically located mitochondria in the perigranular ring and also from the peripheral ring close to the plasma membrane. During the spike there was increased fluorescence in all mitochondrial regions, which then declined after the spike. Finally, the cell was stimulated maximally by a high ACh concentration, causing a marked increase in the cytosolic Ca2+ concentration, as seen in the electrophysiological trace and futher mitochondrial Ca2+ accumulation (image 7).
None
Fig. 6. Serial confocal sectioning reveals essentially complete perigranular mitochondrial belt. An acinar cell triplet (inset transmitted light image) was loaded with Rhod-2 and stimulated maximally with ACh. After the peak response, several confocal sections (see schematic illustration) revealed the almost complete coverage of the granular region by mitochondria. The thickness of the confocal sections was 3.5 µm.
None
Fig. 7. Local and global uncaging of caged Ca2+ causes local and global mitochondrial Ca2+ uptake. (A) Global uncaging. (a) Transmitted light picture showing the three colour-coded regions of interest. Length of red bar corresponds to 10 µm. (b) Schematic diagram indicating recording configuration and experimental arrangement. (c) Time course of mitochondrial Ca2+ uptake, in the three colour-coded regions identified in (A, a), following two separate global cytosolic Ca2+ uncagings (arrowheads). The uncagings cause large increases in the cytosolic Ca2+ concentration (monitored as Ca2+-dependent current). It is seen that this is associated with a uniform increase in the Rhod-2 fluorescence in all regions. (d) An expanded time scale showing the first part of the response to the first uncaging of Ca2+. (B) The effect of local Ca2+ uncaging in the basal region. (a) Transmitted light picture with the three colour-coded regions of interest identified. (b) The mitochondrial Ca2+ concentration changes, in response to the local basal (green area) Ca2+ uncaging, in the three regions (colour coded as in the transmitted light picture). It can be seen that only the mitochondria near the basal plasma membrane react initially, but later there are rather small increases also in the perigranular region.
None
Fig. 8. Local Ca2+ uncaging in the nucleus results in specific Ca2+ uptake into the mitochondria located just around the nucleus and local bleaching experiment indicates that different mitochondrial groups may not communicate directly. (A) Repetitive nuclear Ca2+ uncagings result in increasing Ca2+ uptake exclusively into the perinuclear mitochondrial ring, until suddenly towards the end of the experiment, all mitochondria take up Ca2+. (a) The transmitted light picture shows the site of Ca2+ uncaging (red broken circle) and the colour-coded regions of interest. Length of red bar corresponds to 10 µm. (b) Series of Rhod-2 fluorescence images showing increasing Ca2+ concentration in the perinuclear mitochondrial ring (images 1–5). The last couple of uncagings result in a generalized increase in the cytosolic Ca2+ concentration, which causes major Ca2+ uptake into the mitochondria, also in other regions (images 6 and 7). (c) Graphs representing the time courses of the Ca2+ concentration changes in the cytosol and the mitochondria in different regions following the repetitive Ca2+ uncagings in the nucleus (arrowheads). (B) An area of a cell represented by the broken red rectangle in (a) was bleached and the changes in the Rhod-2 fluorescence intensity, which had just been increased by uncaging of caged Ca2+, were monitored. Length of red bar represents 10 µm. (b) Graph showing that there is a dramatic decrease in the fluorescence intensity in the bleached area (red), which is not transmitted to the neighbouring region (black). (c) Fluorescence images obtained at the times indicated in (b).
None
Fig. 9. Basolateral mitochondrial Ca2+ uptake due to store-operated Ca2+ entry. In this series of experiments, cells were exposed to a Ca2+-free solution containing 0.5 µM thapsigargin for 3 min to partially deplete internal Ca2+ stores. A high external Ca2+ concentration (10 mM) was then introduced, allowing Ca2+ entry through store-operated Ca2+ channels. (A) Series of Rhod-2 fluorescence images showing increasing Ca2+ accumulation in the peripheral mitochondria during the period of Ca2+ entry (images 1–4) and finally the increase in the Ca2+ concentration in the apically located mitochondria after ACh stimulation (image 5). The numbers correspond in time to those shown in (C). (B) Transmitted light image of the cell under investigation with the three colour-coded regions identified. Length of red bar corresponds to 10 µm. (C) The three coloured traces represent mitochondrial Ca2+ measurements (Rhod-2) in the three correspondingly colour-coded regions identified in (B). It is seen that by far the most marked rise in the mitochondrial Ca2+ concentration occurred in the region very close to the basal membrane. At the end of the experiment, a high dose of ACh is applied, causing further increase in the mitochondrial Ca2+ concentration, but this time most marked in the area very close to the apical membrane [see also image 5 in (A)].
None
Fig. 10. Schematic drawing illustrating the locations of the different mitochondrial groups together with directions of Ca2+ transport and indications of ATP supply. For further details see text.

References

    1. Baker P.F. and Knight,D.E. (1978) Calcium-dependent exocytosis in bovine adrenal medullary cells with leaky plasma membranes. Nature, 276, 620–622. - PubMed
    1. Brini M., Murgia,M., Pasti,L., Picard,D., Pozzan,T. and Rizzuto,R. (1993) Nuclear Ca2+ concentration measured with specifically targeted recombinant aequorin. EMBO J., 12, 4813–4819. - PMC - PubMed
    1. Cancela J.M., Gerasimenko,O.V., Gerasimenko,J.V., Tepikin,A.V. and Petersen,O.H. (2000) Two different but converging messenger pathways to intracellular Ca2+ release: the roles of nicotinic acid adenine dinucleotide phosphate, cyclic ADP-ribose and inositol trisphosphate. EMBO J., 19, 2549–2557. - PMC - PubMed
    1. De Giorgi F., Lartigue,L. and Ichas,F. (2000) Electrical coupling and plasticity of the mitochondrial network. Cell Calcium, 28, 365–370. - PubMed
    1. Denton R.M. and McCormack,J.G. (1990) Ca2+ as a second messenger within mitochondria of the heart and other tissues. Annu. Rev. Physiol., 52, 451–466. - PubMed

Publication types