. 2001 Apr 24;98(9):5282-7.
doi: 10.1073/pnas.091094798. Epub 2001 Apr 10.

Tracking memory's trace

Affiliations

Tracking memory's trace

G Horn et al. Proc Natl Acad Sci U S A. .

Abstract

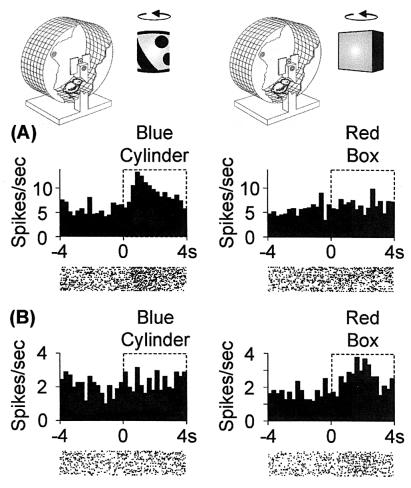
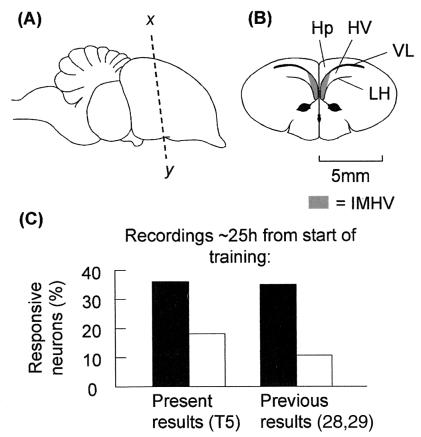
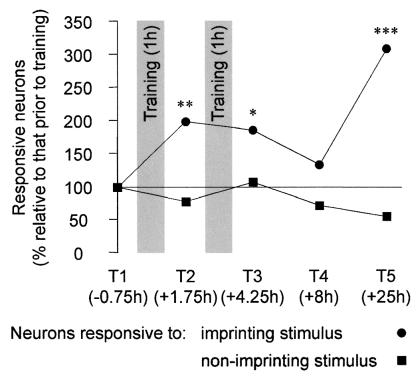
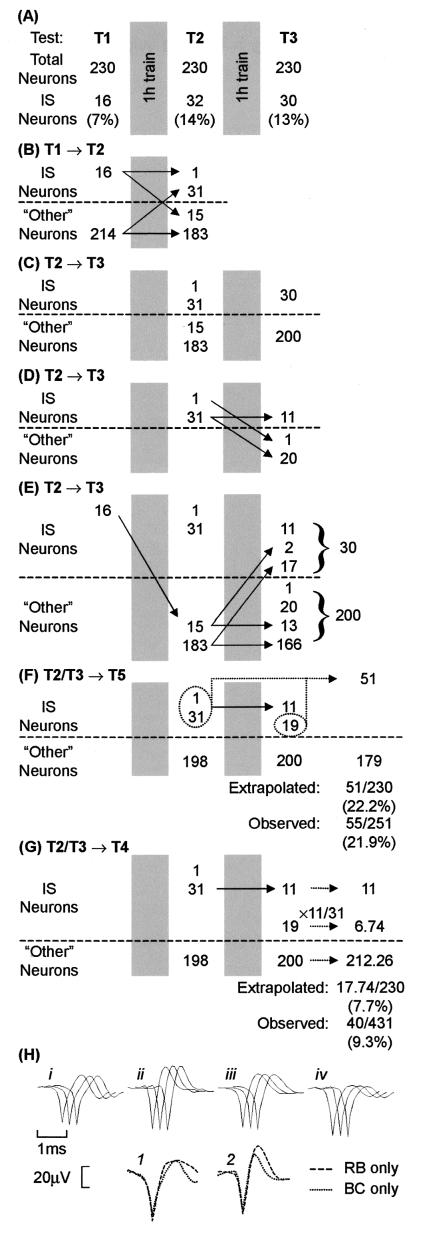
There is strong converging evidence that the intermediate and medial part of the hyperstriatum ventrale of the chick brain is a memory store for information acquired through the learning process of imprinting. Neurons in this memory system come, through imprinting, to respond selectively to the imprinting stimulus (IS) neurons and so possess the properties of a memory trace. Therefore, the responses of the intermediate and medial part of the hyperstriatum ventrale neurons to a visual imprinting stimulus were determined before, during, and after training. Of the total recorded population, the proportions of IS neurons shortly after each of two 1-h training sessions were significantly higher (approximately 2 times) than the pretraining proportion. However, approximately 4.5 h later this proportion had fallen significantly and did not differ significantly from the pretraining proportion. Nevertheless, approximately 21.5 h after the end of training, the proportion of IS neurons was at its highest (approximately 3 times the pretraining level). No significant fluctuations occurred in the proportions of neurons responding to the alternative stimulus. In addition, nonmonotonic changes were found commonly in the activity of 230 of the neurons tracked individually from before training to shortly after the end of training. Thus the pattern of change in responsiveness both at the population level and at the level of individual neurons was highly nonmonotonic. Such a pattern of change is not consistent with simple models of memory based on synaptic strengthening to asymptote. A model is proposed that accounts for the changes in the population responses to the imprinting stimulus in terms of changes in the responses of individual neurons.


Figures

Figure 1
Figure 1
Responses of IMHV neurons. Above the upper histogram bars are shown chicks in running wheels. For purposes of illustration one of the opaque sides of each wheel is cut away. Chicks face a rotating BC on the left and a rotating RB on the right. (A and B) Example response histograms and raster plots of responses to either the RB or the BC. Neurons were tested for responsiveness to each stimulus. (A) Neuron in BC-trained chick responding to the BC but not RB. (B) Neuron in an RB-trained chick responding to the RB but not BC.
Figure 2
Figure 2
Proportions of IMHV neurons responding to an imprinting stimulus and a nonimprinting stimulus. (A) Side view of chick brain. (B) Frontal section through x–y in A. The shaded areas show the IMHV region, from which the recordings were made. Abbreviations: Hp, hippocampus; HV, hyperstriatum ventrale; LH, lamina hyperstriatica; VL, lateral ventricle. (C) Proportions of neurons responsive to the imprinting stimulus (filled bars) and a nonimprinting stimulus (open bars) in the present (T5) and previous studies (28, 29). The proportions of neurons responsive to a nonimprinting stimulus in trained and untrained chicks did not differ significantly and were combined. The proportions of neurons responsive to the imprinting stimulus were significantly higher than the proportions responsive to a nonimprinting stimulus (present results, BEM χformula image = 15.6, P < 0.001; previous results, BEM χformula image = 39.0, P < 0.001).
Figure 3
Figure 3
Population neuronal responsiveness to the imprinting and nonimprinting stimuli. The change (%) in the proportions of neurons responsive to the IS (●) and a NIS (■), relative to the proportion responsive before training are shown for Tests T1–T5 (the mean mid-points of the Tests relative to the start of training are indicated). The proportion of neurons responsive to the IS increased significantly to T2 (BEMχformula image = 6.7, **, P < 0.01) and T3 (BEM χformula image = 5.2, *, P = 0.023). At T4 the proportion of neurons responsive to the IS was significantly less than the pooled proportions at T2 and T3 (BEMχformula image = 4.5, P = 0.034) and was not significantly different from that at T1. At T5 the proportion of neurons responsive to the IS was significantly higher than that at T1 (BEM χformula image = 20.8, ***, P < 0.001) and that at T4 (BEMχformula image = 4.9, P = 0.027).
Figure 4
Figure 4
Tracking the responsiveness of individual neurons. (A) In trained chicks, the activity of 230 neurons was recorded throughout the period spanning T1–T3 and the numbers of neurons responding to the imprinting stimulus (IS neurons) are shown. The pattern of change in neurons responding to the imprinting stimulus, or not doing so (other neurons) are shown for T1→T2 (B) and T2→T3 (CE). The extrapolated numbers of IS neurons at T5 and T4 are indicated by broken lines in F and G, respectively. The observed and extrapolated proportions of IS neurons in the population are also shown. (H) Averaged action potential waveforms for four neurons are shown.(i–iv) In each set of three waveforms (e.g., i), each waveform (left to right) is reconstructed from activity in Tests T1, T2, and T3, respectively. Each neuron was sampled from a different chick. Neurons responded as follows: (i) IS neuron at T1 and T2, and other at T3, (ii) other at T1, IS at T2, and other at T3; (iii) other at T1 and T2, and IS at T3; and (iv) IS at T1, other at T2, and IS at T3. The averaged action potential waveforms superimposed in 1 have been reconstructed from activity simultaneously sampled through a single microelectrode. Those in 2 were also simultaneously sampled through a single microelectrode, although from a different chick. In both 1 and 2, the two neurons were differentially responsive, one (dashed line) responding to the RB but not to the BC, and the other (dotted line) responding to the BC but not to the RB.

References

    1. James W. The Principles of Psychology. New York: Holt; 1890.
    1. Cajal S R. Histologie du Système Nerveux de l'Homme et des Vertébrés. Paris: Maloine; 1911.
    1. Hebb D O. The Organization of Behavior. New York: Wiley; 1949.
    1. Lashley K S. Symp Soc Exp Biol. 1950;4:454–482.
    1. Kim J J, Thompson R F. Trends Neurosci. 1997;20:177–181. - PubMed

Publication types