. 2001 Apr 10;98(8):4343-8.
doi: 10.1073/pnas.081070798.

Toward rules for 1:1 polyamide:DNA recognition

Affiliations

Toward rules for 1:1 polyamide:DNA recognition

A R Urbach et al. Proc Natl Acad Sci U S A. .

Abstract

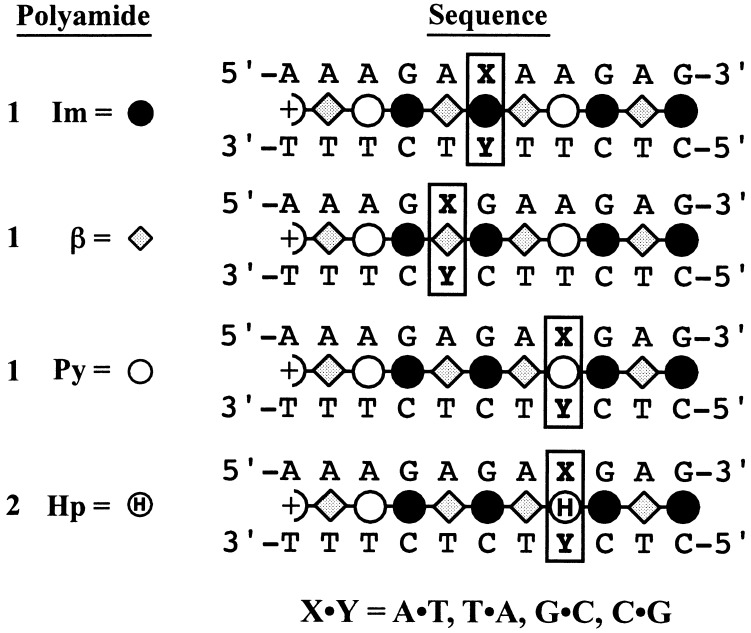
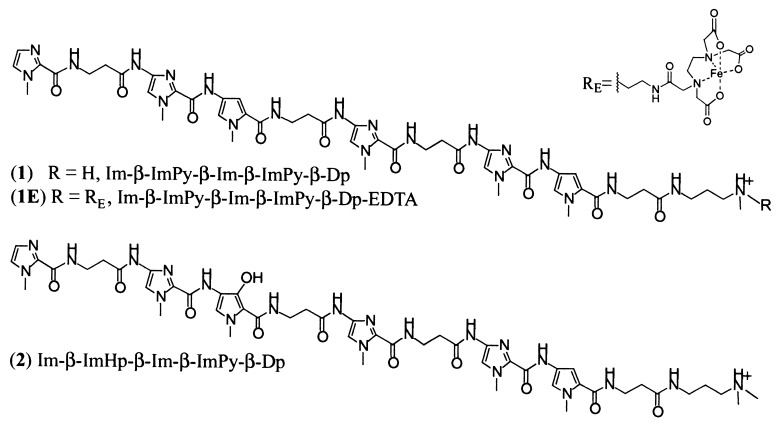
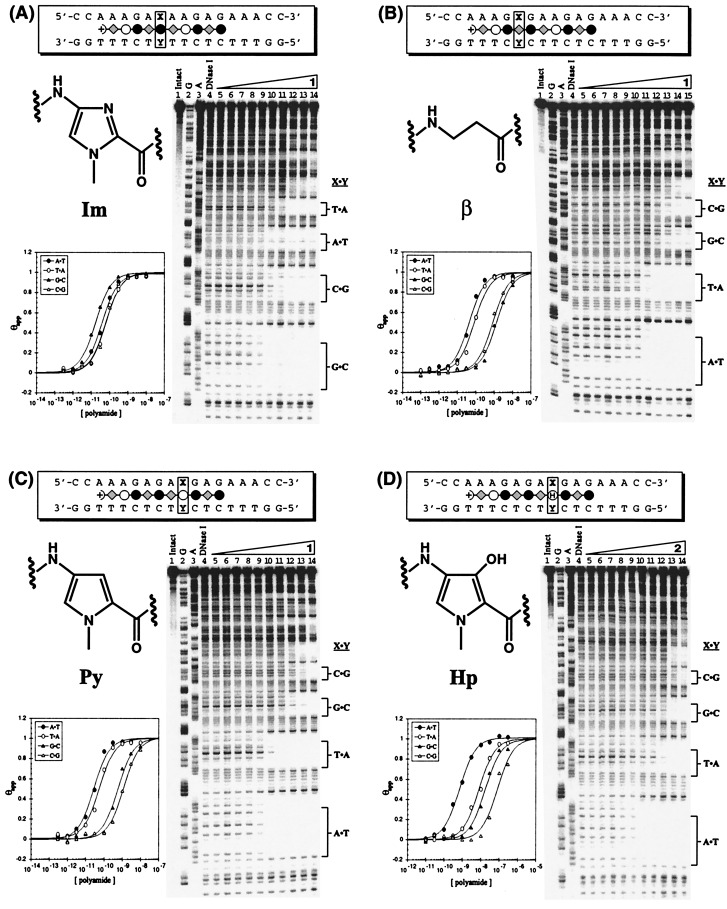
Polyamides composed of four amino acids, imidazole (Im), pyrrole (Py), hydroxypyrrole (Hp), and beta-alanine (beta), are synthetic ligands that form highly stable complexes in the minor groove of DNA. Although specific pairing rules within the 2:1 motif can be used to distinguish the four Watson. Crick base pairs, a comparable recognition code for 1:1 polyamide:DNA complexes had not been described. To set a quantitative baseline for the field, the sequence specificities of Im, Py, Hp, and beta for the four Watson. Crick base pairs were determined for two polyamides, Im-beta-ImPy-beta-Im-beta-ImPy-beta-Dp (1, for Im, Py, and beta) and Im-beta-ImHp-beta-Im-beta-ImPy-beta-Dp (2, for Hp), in a 1:1 complex within the DNA sequence context 5'-AAAGAGAAGAG-3'. Im residues do not distinguish G,C from A,T but bind all four base pairs with high affinity. Py and beta residues exhibit > or = 10-fold preference for A,T over G,C base pairs. The Hp residue displays a unique preference for a single A.T base pair with an energetic penalty.


Figures

Figure 1
Figure 1
Schematic illustrating the examination of sequence selectivity at a single imidazole (Im), beta alanine (β), pyrrole (Py), or hydroxypyrrole (Hp) position within the parent context, 5′-AAAGAGAAGAG-3′. Imidazole and pyrrole rings are represented as filled and open circles, respectively; β-alanines are shown as gray diamonds; and hydroxypyrrole is indicated by a circle containing the letter H.
Figure 2
Figure 2
Structures of polyamides 1, 1E, and 2 with their polyamide sequences.
Figure 3
Figure 3
Quantitative DNase I footprint titration experiments for polyamide 1 on the 298-bp, 5′-end-labeled PCR product of plasmids pAU8 (A), pAU15 (B), and pAU12 (C), as well as polyamide 2 on the same fragment of pAU12 (D). (A and C) Lane 1, intact DNA; lane 2, G reaction; lane 3, A reaction; lane 4, DNase I standard; lanes 5–14, 300 fM, 1 pM, 3 pM, 10 pM, 30 pM, 100 pM, 300 pM, 1 nM, 3 nM, 10 nM 1, respectively. (B) Lane 1, intact DNA; lane 2, G reaction; lane 3, A reaction; lane 4, DNase I standard; lanes 5–15, 100 fM, 300 fM, 1 pM, 3 pM, 10 pM, 30 pM, 100 pM, 300 pM, 1 nM, 3 nM, 10 nM 1, respectively. (D) Lane 1, intact DNA; lane 2, G reaction; lane 3, A reaction; lane 4, DNase I standard; lanes 5–14, 10 pM, 30 pM, 100 pM, 300 pM, 1 nM, 3 nM, 10 nM, 30 nM, 100 nM, 300 nM 2, respectively. Each footprinting gel is accompanied by the following: (Top) Binding schematic with the mutated position boxed; (Middle Left) chemical structure of the monomer of interest; and (Bottom Left) binding isotherms for the four designed sites. θnorm values were obtained according to published methods (8). The data points for the solid lines are best-fit Langmuir binding titration isotherms obtained by a nonlinear, least-squares algorithm.
Figure 4
Figure 4
(Left) Quantitative DNase I footprint titration experiment for polyamide 1 on the 298-bp, 5′-end-labeled PCR product from plasmid pAU18: lane 1, intact DNA; lane 2, G reaction; lane 3, A reaction; lane 4, DNase I standard; lanes 5–14, 300 fM, 1 pM, 3 pM, 10 pM, 30 pM, 100 pM, 300 pM, 1 nM, 3 nM, 10 nM 1, respectively. (Center) Affinity cleavage experiment with polyamide 1E on the same PCR product of plasmid pAU18: lanes 1–3, 1 nM, 3 nM, and 10 nM 1E, respectively; lane 4, A reaction; lane 5, G reaction; lane 6, intact DNA. (Right) Schematic illustrating the observed affinity cleavage patterns with arrows representing relative cleavage intensities. Polyamides are drawn as oriented, 1:1 complexes, as observed by affinity cleavage. Equilibrium association constants, Ka, are listed below each binding site.

References

    1. Kopka M L, Yoon C, Goodsell D, Pjura P, Dickerson R E. Proc Natl Acad Sci USA. 1985;82:1376–1380. - PMC - PubMed
    1. Pelton J G, Wemmer D E. Proc Natl Acad Sci USA. 1989;86:5723–5727. - PMC - PubMed
    1. Dervan P B, Bürli R W. Curr Opin Chem Biol. 1999;3:688–693. - PubMed
    1. Youngquist R S, Dervan P B. Proc Natl Acad Sci USA. 1985;82:2565–2569. - PMC - PubMed
    1. Kelly J J, Baird E E, Dervan P B. Proc Natl Acad Sci USA. 1996;93:6981. - PMC - PubMed

Publication types