

Regulation of neuroblast mitosis is determined by PACAP receptor isoform expression
- PMID: 11296303
- PMCID: PMC31907
- DOI: 10.1073/pnas.071465398
Regulation of neuroblast mitosis is determined by PACAP receptor isoform expression
Abstract
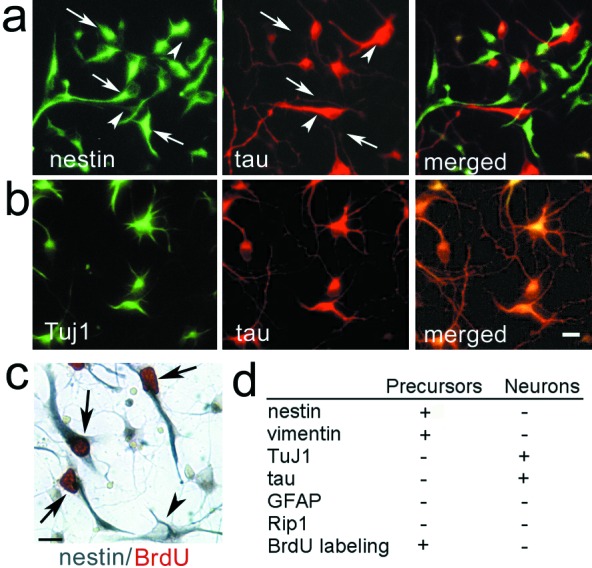
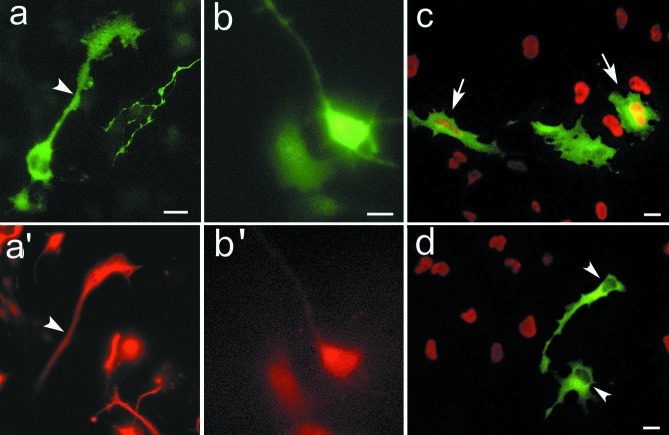
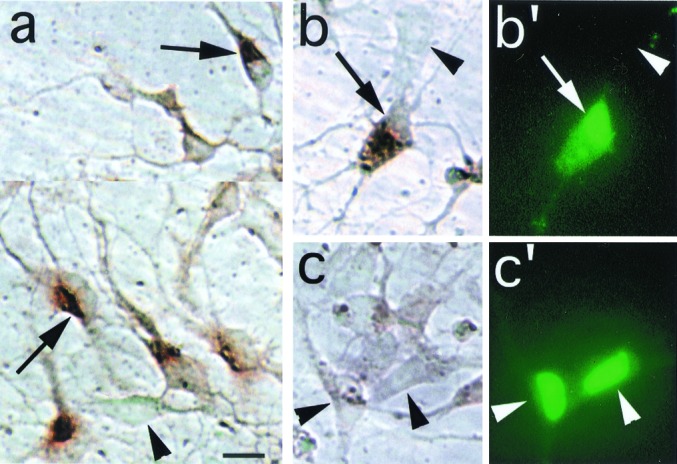
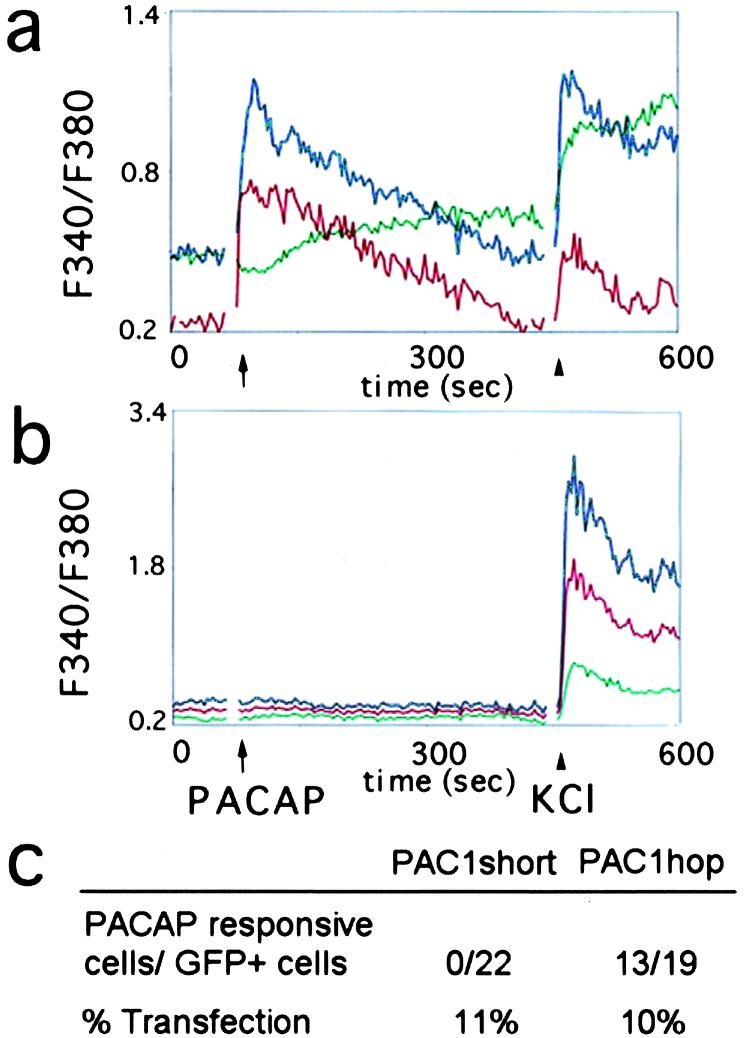
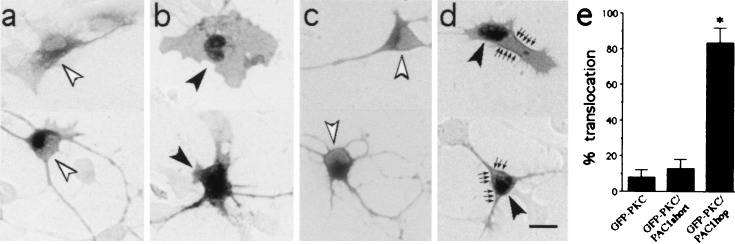
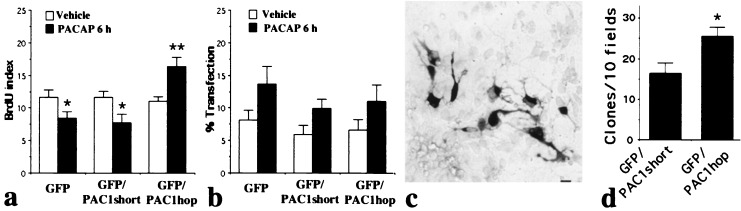
Although neurogenesis in the embryo proceeds in a region- or lineage-specific fashion coincident with neuropeptide expression, a regulatory role for G protein-coupled receptors (GPCR) remains undefined. Pituitary adenylate cyclase activating polypeptide (PACAP) stimulates sympathetic neuroblast proliferation, whereas the peptide inhibits embryonic cortical precursor mitosis. Here, by using ectopic expression strategies, we show that the opposing mitogenic effects of PACAP are determined by expression of PACAP receptor splice isoforms and differential coupling to the phospholipase C (PLC) pathway, as opposed to differences in cellular context. In embryonic day 14 (E14) cortical precursors transfected with the hop receptor variant, but not cells transfected with the short variant, PACAP activates the PLC pathway, increasing intracellular calcium and eliciting translocation of protein kinase C. Ectopic expression of the hop variant in cortical neuroblasts transforms the antimitotic effect of PACAP into a promitogenic signal. Furthermore, PACAP promitogenic effects required PLC pathway function indicated by antagonist U-73122 studies in hop-transfected cortical cells and native sympathetic neuroblasts. These observations highlight the critical role of lineage-specific expression of GPCR variants in determining mitogenic signaling in neural precursors.
Figures
Similar articles
-
Opposing mitogenic regulation by PACAP in sympathetic and cerebral cortical precursors correlates with differential expression of PACAP receptor (PAC1-R) isoforms.J Neurosci Res. 1998 Sep 15;53(6):651-62. doi: 10.1002/(SICI)1097-4547(19980915)53:6<651::AID-JNR3>3.0.CO;2-4. J Neurosci Res. 1998. PMID: 9753193
-
Pro- and anti-mitogenic actions of pituitary adenylate cyclase-activating polypeptide in developing cerebral cortex: potential mediation by developmental switch of PAC1 receptor mRNA isoforms.J Neurosci. 2013 Feb 27;33(9):3865-78. doi: 10.1523/JNEUROSCI.1062-12.2013. J Neurosci. 2013. PMID: 23447598 Free PMC article.
-
Autocrine expression and ontogenetic functions of the PACAP ligand/receptor system during sympathetic development.Dev Biol. 2000 Mar 15;219(2):197-213. doi: 10.1006/dbio.2000.9604. Dev Biol. 2000. PMID: 10694416
-
Pituitary adenylate cyclase-activating polypeptide (PACAP) and its receptors in the brain.Kaibogaku Zasshi. 2000 Dec;75(6):487-507. Kaibogaku Zasshi. 2000. PMID: 11197592 Review.
-
The PACAP ligand/receptor system regulates cerebral cortical neurogenesis.Ann N Y Acad Sci. 1998 Dec 11;865:274-89. doi: 10.1111/j.1749-6632.1998.tb11188.x. Ann N Y Acad Sci. 1998. PMID: 9928022 Review.
Cited by
-
Changes in the expression of pituitary adenylate cyclase-activating polypeptide in the human placenta during pregnancy and its effects on the survival of JAR choriocarcinoma cells.J Mol Neurosci. 2010 Nov;42(3):450-8. doi: 10.1007/s12031-010-9374-5. Epub 2010 May 7. J Mol Neurosci. 2010. PMID: 20449689
-
Pituitary adenylyl cyclase-activating peptide counteracts hedgehog-dependent motor neuron production in mouse embryonic stem cell cultures.J Neurosci Res. 2011 Sep;89(9):1363-74. doi: 10.1002/jnr.22675. Epub 2011 Jun 14. J Neurosci Res. 2011. PMID: 21674568 Free PMC article.
-
Direct cAMP signaling through G-protein-coupled receptors mediates growth cone attraction induced by pituitary adenylate cyclase-activating polypeptide.J Neurosci. 2003 Mar 15;23(6):2274-83. doi: 10.1523/JNEUROSCI.23-06-02274.2003. J Neurosci. 2003. PMID: 12657686 Free PMC article.
-
Convergent phosphomodulation of the major neuronal dendritic potassium channel Kv4.2 by pituitary adenylate cyclase-activating polypeptide.Neuropharmacology. 2016 Feb;101:291-308. doi: 10.1016/j.neuropharm.2015.10.006. Epub 2015 Oct 9. Neuropharmacology. 2016. PMID: 26456351 Free PMC article.
-
Pituitary adenylate cyclase-activating polypeptide (PACAP)/PAC1HOP1 receptor activation coordinates multiple neurotrophic signaling pathways: Akt activation through phosphatidylinositol 3-kinase gamma and vesicle endocytosis for neuronal survival.J Biol Chem. 2010 Mar 26;285(13):9749-9761. doi: 10.1074/jbc.M109.043117. Epub 2010 Jan 21. J Biol Chem. 2010. PMID: 20093365 Free PMC article.
References
-
- Temple S, Qian X. Neuron. 1995;15:249–252. - PubMed
-
- LoTurco J J, Owens D F, Heath M J, Davis M B, Kriegstein A R. Neuron. 1995;15:1287–1298. - PubMed
-
- Antonopoulos J, Pappas I S, Parnavelas J G. Eur J Neurosci. 1997;9:291–298. - PubMed
-
- Vaccarino F M, Schwartz M L, Raballo R, Nilsen J, Rhee J, Zhou M, Doetschman T, Coffin J D, Wyland J J, Hung Y T. Nat Neurosci. 1999;2:246–253. - PubMed
Publication types
MeSH terms
Substances
Grants and funding
LinkOut - more resources
Full Text Sources
Other Literature Sources
