. 2001 Apr 1;15(7):902-11.
doi: 10.1101/gad.866201.

ABP1 is required for organized cell elongation and division in Arabidopsis embryogenesis

Affiliations

ABP1 is required for organized cell elongation and division in Arabidopsis embryogenesis

J G Chen et al. Genes Dev. .

Abstract

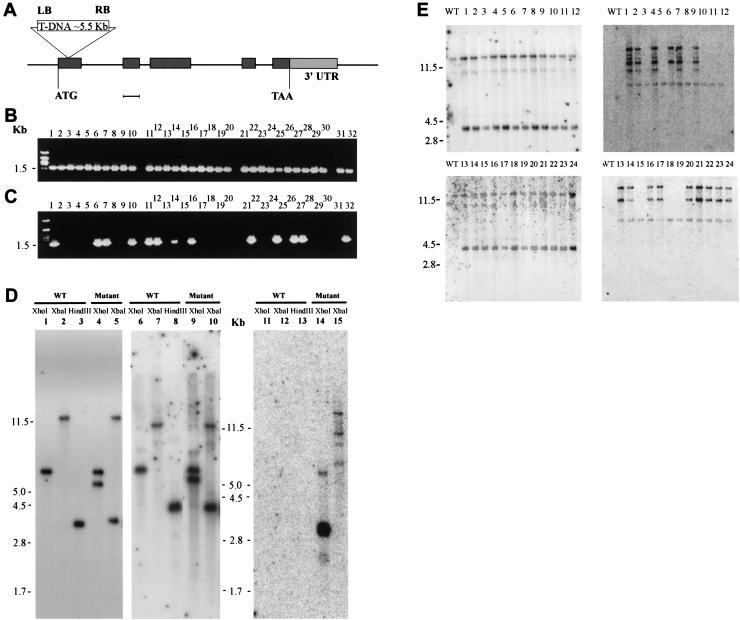
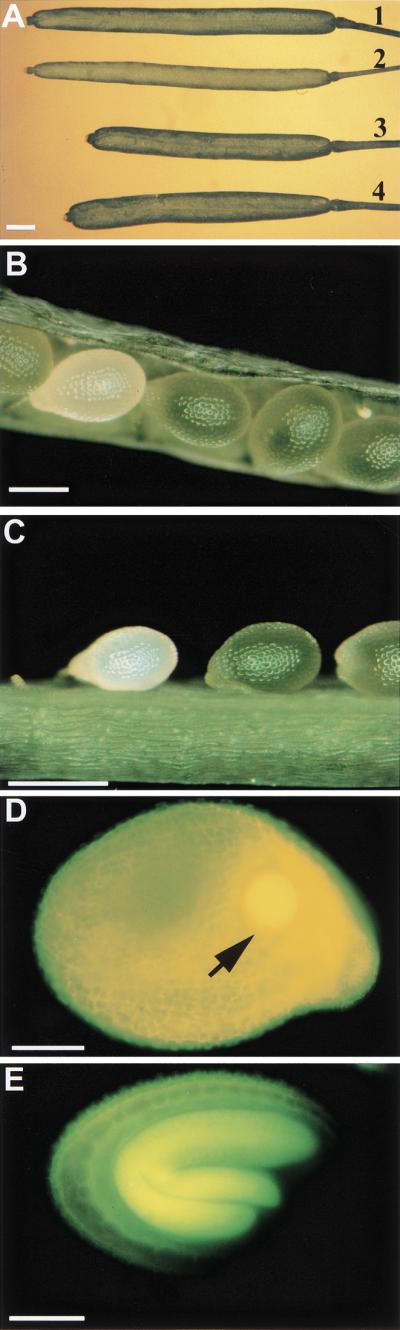
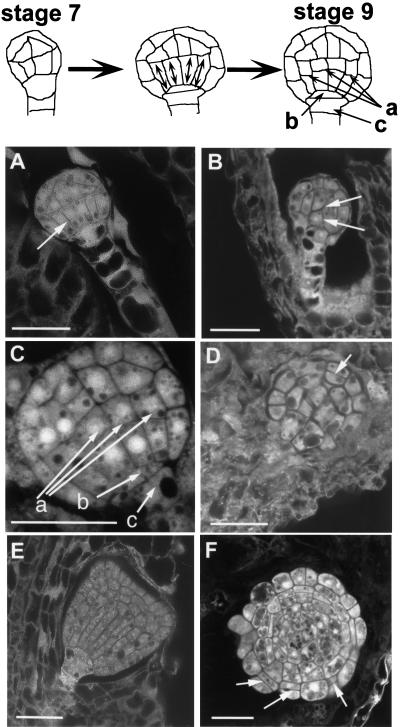
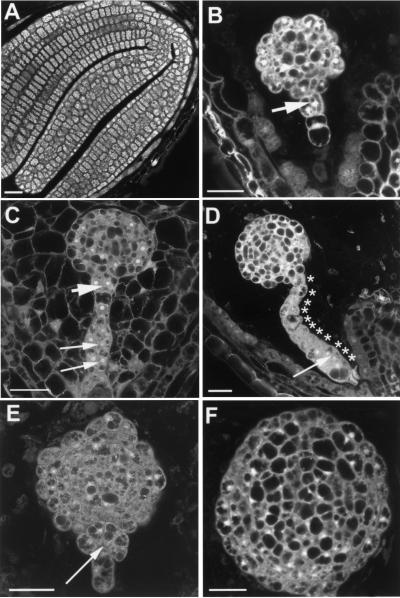
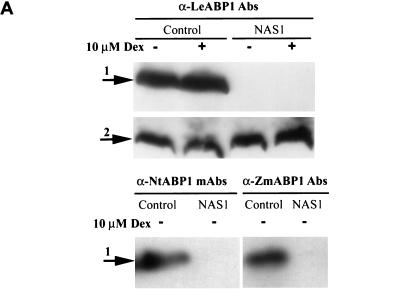
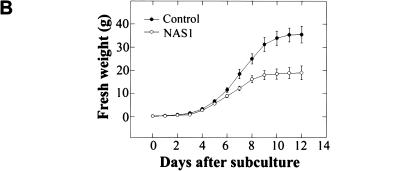
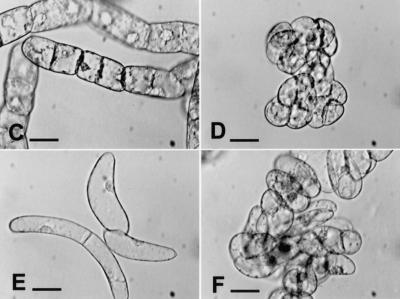
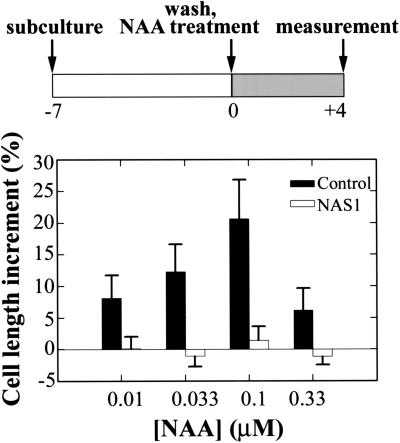
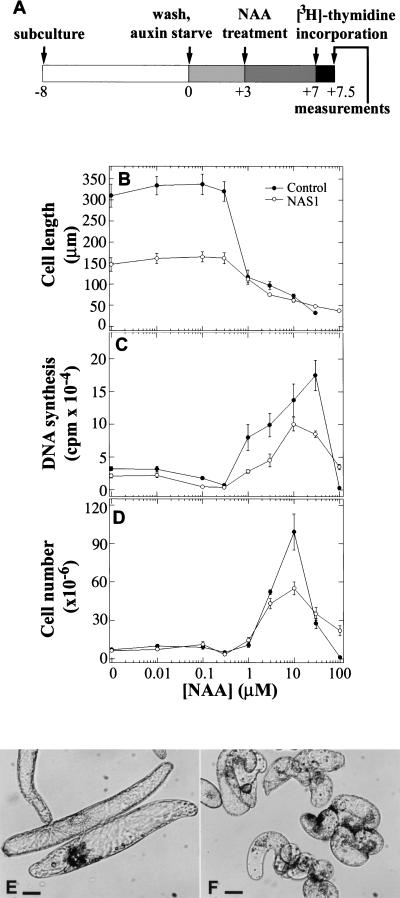
To directly address the function of a putative auxin receptor designated ABP1, a reverse genetic approach was taken to identify and characterize ABP1 mutant alleles in Arabidopsis. A homozygous null mutation in ABP1 confers embryo lethality. Null mutant embryos develop normally until the early stages of the globular embryo but are unable to make the transition to a bilaterally symmetrical structure because cells fail to elongate. Cell division was also aberrant both in the suspensor and embryo proper. Antisense suppression of ABP1 in tobacco cells causes slow proliferation and eliminates auxin-induced cell elongation and reduces cell division. The complete lack of auxin-inducible elongation in individual cells confirms the results observed in embryos, indicates a cell autonomous function, and, taken together with biochemical evidence that ABP1 binds auxins, suggests that ABP1 mediates auxin-induced cell elongation and, directly or indirectly, cell division.


Figures

Figure 1
Figure 1
Isolation of ABP1 knockout allele. (A) T-DNA insertion site in ABP1. (LB) T-DNA left border, (RB) T-DNA right border. Dark gray boxes represent exons. Light gray box represents 3′ untranslated region (3′UTR). Bar, 100 bp, although the T-DNA insert (white box) is not drawn to scale. (B,C) PCR screening for abp1 T-DNA insertion mutants from 32 T3 plants, by use of ABP1 forward and reverse primers to amplify the wild-type allele (B), and T-DNA RB and ABP1 reverse primers to amplify the mutant allele (C). (D) Southern blot analyses of ABP1 gene and knockout allele. The blots were hybridized with a genomic ABP1 probe (left), a cDNA PCR product (middle), and a T-DNA pD991 plasmid DNA (∼5.5 kb) (right), respectively. Blots were washed at high stringency (left and right) and low stringency (middle ), respectively. (E) Southern blot screening for single T-DNA insertion abp1 mutants from 24 F2 plants (T3 plants heterozygous at the abp1 locus was backcrossed to wild-type Wassilewskija. F1 and F2 plants were selected by 50 μg/mL kanamycin). Blots were hybridized with genomic ABP1 probe (left) and T-DNA pD991 plasmid DNA (right). Plants heterozygous at the abp1 locus with single T-DNA insertion (plants 3, 5, 8, 10, 11, 12, 15, 18, 19) were selected for subsequent analyses.
Figure 2
Figure 2
Immature seed segregation in plants heterozygous at the abp1 locus. (A) Siliques of wild-type Wassilewskija and Landsberg erecta plants (1 and 3) and mutant plant heterozygous at the abp1 locus in the corresponding ecotypes (2 and 4). (B,C) Immature seeds segregate within single silique of plants heterozygous at the abp1 locus. (D,E) Microscopy image of white (D) and green (E) immature seeds from single silique of mutant plant heterozygous at the abp1 locus in B and C. Images were obtained by use of a 490-nm excitation filter. Arrow in D indicates a globular abp1 embryo of the same developmental age as the wild-type embryo shown in E. Scale bars, 500 μm in A–C, and 100 μm in D and E.
Figure 3
Figure 3
Development of abp1 embryos. (Top) Normal progression of embryo development from dermatogen (stage 7) to midglobular (stage 9) embryos. Lower tier cells expand axially (indicated by double-headed arrows) before dividing anticlinally (arrows a). (A–F) Developmental stages are as follows: (A) wild-type embryo at early-globular stage (approximately stage 7). Arrow indicates elongated cells of the lower tier; (B) abp1 embryo at early-globular stage, from the same silique as A. Arrows in B indicate the misoriented newly formed cross walls; (C) wild-type embryo at mid-globular stage (approximately stage 9). The arrows labeled a–c correspond to structures indicated at top; (D) abp1 embryo at mid-globular stage, from the same silique as C. Arrow indicates a periclinal division in the outer layer cells; (E) wild-type embryo at early-heart stage; (F) abp1 embryo arrested at globular stage, from the same silique as E. Arrows in F indicate periclinal divisions in the outer layer cells. The view shown in Fig. 3 is likely a medial transverse section. Images were obtained by confocal microscopy (YHS filter block, 568 nm excitation, Zeiss LSM 410 equipped with an Argon/Krypton laser). Fixation, clearing, and visualization of materials were by the method of Christensen et al. (1997). Scale bars, 25 μm.
Figure 4
Figure 4
Developmental arrest of abp1 embryos. (A) Abp1 + embryo at mature cotyledon stage, (B–F) Abp1 embryos, from the same silique as A. Arrows with large arrowhead in B and C indicate an extra cell division in the apical suspensor. Long arrows in C indicate periclinal cell division. Arrow in D indicates an anticlinal cell division. Asterisks indicate individual cells along the suspensor. Arrow in E indicates the abnormal junction between embryo proper and suspensor. Scale bars, 25 μm.
Figure 5
Figure 5
Antisense suppression of ABP1 in BY-2 cells. (A) Immunoblot analyses of ABP1 protein levels in crude microsomal fractions from control and an ABP1-antisense suppressed BY-2 cell line (designated NAS1) 5 d after subculture in the presence or absence of 10 μM dexamethasone (Dex), using anti-tomato ABP1 polyclonal Abs (α-LeABP1 Abs, top), anti-tobacco ABP1 monoclonal antibodies (α-NtABP1 mAbs, bottom, left), and anti-maize ABP1 polyclonal antibodiess (α-ZmABP1 Abs, bottom, right). Arrow 1 indicates the expected band for NtABP1; arrow 2 indicates a nonspecific band recognized by anti-LeABP1 Abs, which serves as an internal loading control. Even though the antisense construct is driven by a Dex-inducible promoter, these cells essentially show constitutive suppression of ABP1 due to high basal level of expression of the antisense construct. Therefore, further analyses shown were done in the absence of Dex. (B) Growth rate of NAS1 cells. Medium containing 2,4-D (9 × 10⁻⁷ M) were seeded with equal numbers of cells (1.7 × 10⁶ cells) and fresh weight determined over time. Fresh weight increase after day 7 is due primarily to cell expansion with little accompanying division. The graph shows the mean ±S.E. of three replicates. (C) Control and (D) NAS1 cells in the division phase, 4 d after subculture. (E) Control and (F) NAS1 cells in the expansion stage, 11 d after subculture. Scale bars, 50 μm.
Figure 5
Figure 5
Antisense suppression of ABP1 in BY-2 cells. (A) Immunoblot analyses of ABP1 protein levels in crude microsomal fractions from control and an ABP1-antisense suppressed BY-2 cell line (designated NAS1) 5 d after subculture in the presence or absence of 10 μM dexamethasone (Dex), using anti-tomato ABP1 polyclonal Abs (α-LeABP1 Abs, top), anti-tobacco ABP1 monoclonal antibodies (α-NtABP1 mAbs, bottom, left), and anti-maize ABP1 polyclonal antibodiess (α-ZmABP1 Abs, bottom, right). Arrow 1 indicates the expected band for NtABP1; arrow 2 indicates a nonspecific band recognized by anti-LeABP1 Abs, which serves as an internal loading control. Even though the antisense construct is driven by a Dex-inducible promoter, these cells essentially show constitutive suppression of ABP1 due to high basal level of expression of the antisense construct. Therefore, further analyses shown were done in the absence of Dex. (B) Growth rate of NAS1 cells. Medium containing 2,4-D (9 × 10⁻⁷ M) were seeded with equal numbers of cells (1.7 × 10⁶ cells) and fresh weight determined over time. Fresh weight increase after day 7 is due primarily to cell expansion with little accompanying division. The graph shows the mean ±S.E. of three replicates. (C) Control and (D) NAS1 cells in the division phase, 4 d after subculture. (E) Control and (F) NAS1 cells in the expansion stage, 11 d after subculture. Scale bars, 50 μm.
Figure 6
Figure 6
Auxin-induced cell elongation in BY-2 cells. At top is shown the experimental scheme in which numbers indicate days. The lengths of control (solid bars) and NAS1 (open bars) cells cultured in the indicated concentrations of NAA were measured. Cell length increment is shown as a percentage over growth in the absence of auxin. The graph shows the mean ±S.E. of three replicates.
Figure 7
Figure 7
Dose response of ABP1 antisense suppression in BY-2 cells (NAS1) to auxin. (A) The experimental scheme. Numbers indicate the time course (day). Cells were synchronized by auxin starvation for 3 d, then transferred to medium containing the indicated concentrations of auxin. A pulse of [3H] thymidine was applied at day 7. Cell length, [3H]thymidine incorporation and length were determined 12 h later. (B–D) Measurements of the response of control and NAS1 cells to NAA in terms of cell length (B), DNA synthesis by [3H]thymidine incorporation (C), and cell number (D). Starting cultures were seeded with 4.0 × 10⁶ cells. The graphs show the mean ±S.E. of three replicates. (E,F) Control and NAS1 cells at 10−7 M of NAA. Images taken 4.5 d after NAA treatment. Scale bars, 50 μm.

Similar articles

Cited by

References

    1. Barbier-Brygoo H, Ephritikhine G, Klambt D, Ghislan M, Guern J. Functional evidence for an auxin receptor at the plasmalemma of tobacco protoplasts. Proc Natl Acad Sci. 1989;86:891–895. - PMC - PubMed
    1. Barbier-Brygoo H, Ephritikhine G, Klambt D, Maurel C, Palme K, Schell J, Guern J. Perception of the auxin signal at the plasma membrane of tobacco mesophyll protoplasts. Plant J. 1991;1:83–93. - PubMed
    1. Batt S, Wilkens MB, Venis MA. Auxin binding to corn coleoptile membranes: Kinetics and specificity. Planta. 1976;130:7–13. - PubMed
    1. Bechtold N, Pelletier G. In planta Agrobacterium-mediated transformation of adult Arabidopsis thaliana plants by vacuum infiltration. Methods Mol Biol. 1998;82:259–266. - PubMed
    1. Birnbaumer L, Pohl SL, Kaumann AJ. Receptors and acceptors: A necessary distinction in hormone binding studies. In: Greengard P, Robison GG, editors. Advances in cyclic nucleotide research. New York: North-Holland; 1974. pp. 239–281. - PubMed

Publication types

MeSH terms