. 2001 Apr;125(4):1643-54.
doi: 10.1104/pp.125.4.1643.

Salt-induced expression of the vacuolar H+-ATPase in the common ice plant is developmentally controlled and tissue specific

Affiliations

Salt-induced expression of the vacuolar H+-ATPase in the common ice plant is developmentally controlled and tissue specific

D Golldack et al. Plant Physiol. 2001 Apr.

Abstract

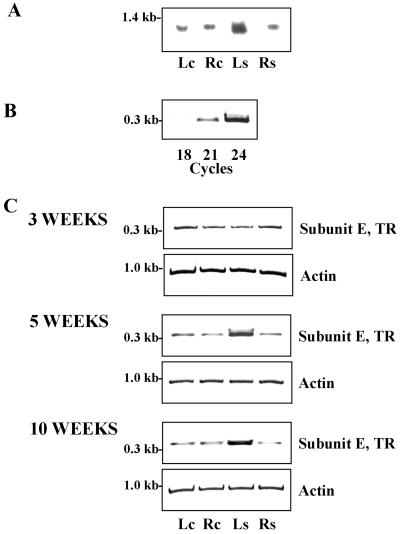
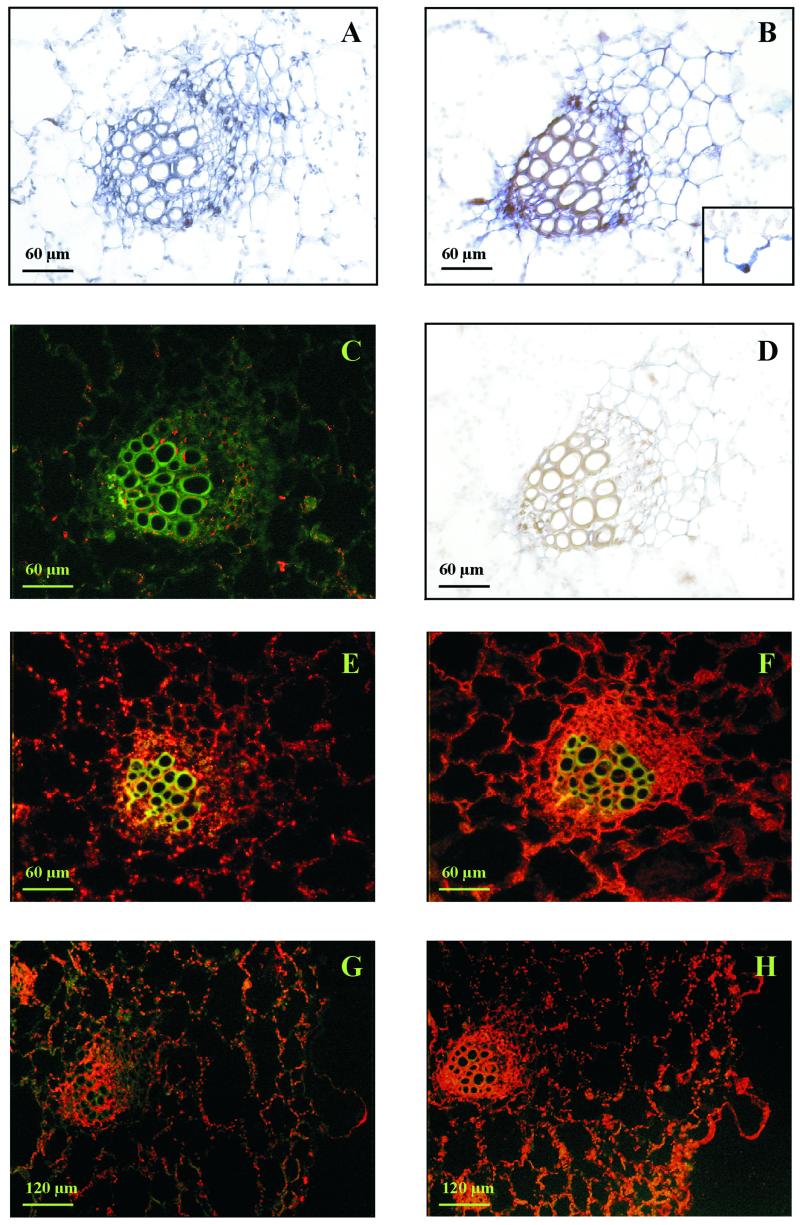
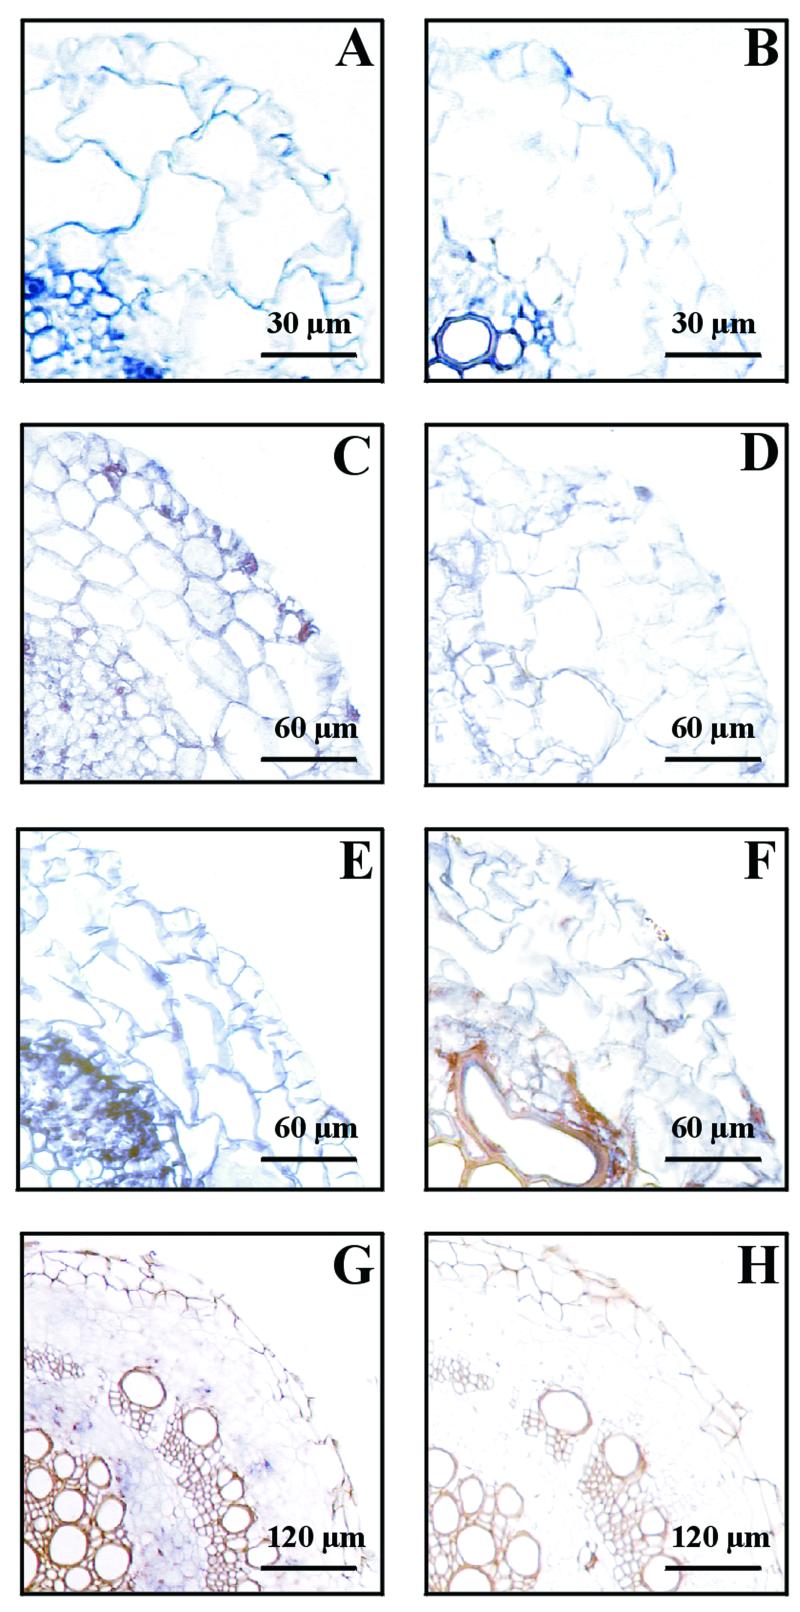
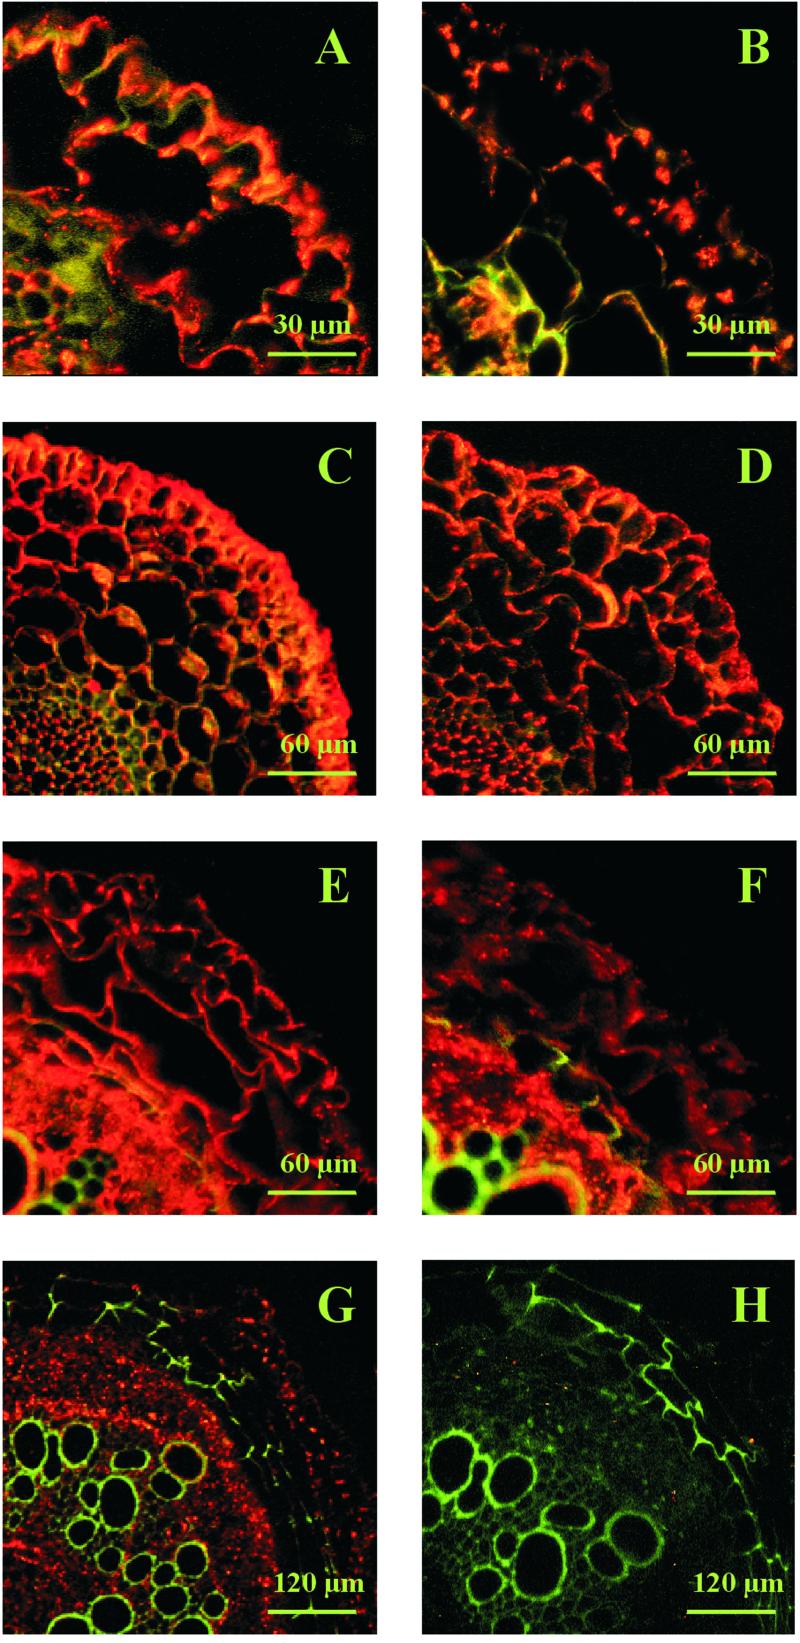
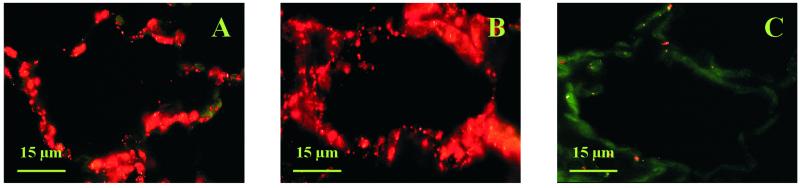
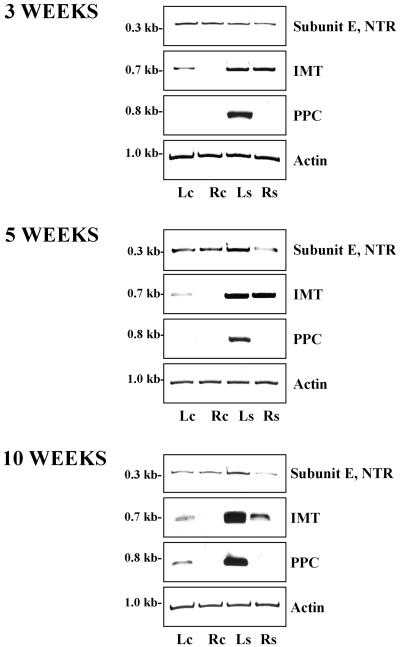
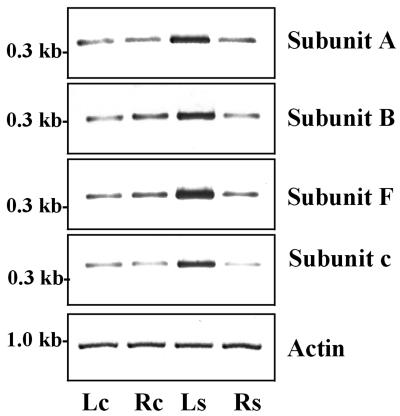
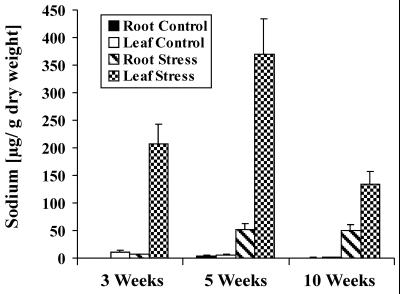
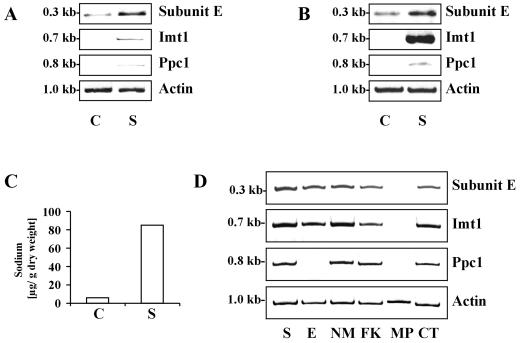
For salinity stress tolerance in plants, the vacuolar type H+-ATPase (V-ATPase) is of prime importance in energizing sodium sequestration into the central vacuole and it is known to respond to salt stress with increased expression and enzyme activity. In this work we provide information that the expressional response to salinity of the V-ATPase is regulated tissue and cell specifically under developmental control in the facultative halophyte common ice plant (Mesembryanthemum crystallinum). By transcript analysis of subunit E of the V-ATPase, amounts did not change in response to salinity stress in juvenile plants that are not salt-tolerant. In a converse manner, in halotolerant mature plants the transcript levels increased in leaves, but not in roots when salt stressed for 72 h. By in situ hybridizations and immunocytological protein analysis, subunit E was shown to be synthesized in all cell types. During salt stress, signal intensity declined in root cortex cells and in the cells of the root vascular cylinder. In salt-stressed leaves of mature plants, the strongest signals were localized surrounding the vasculature. Within control cells and with highest abundance in mesophyll cells of salt-treated leaves, accumulation of subunit E protein was observed in the cytoplasm, indicating its presence not only in the tonoplast, but also in other endoplasmic compartments.


Figures

Figure 1
Figure 1
Tissue-specific differences in transcript accumulation of V-ATPase subunit E in common ice plant. A, Northern-blot analysis of total RNA (15 μg per lane) isolated fom leaves (Lc) and roots (Rc) of 5-week-old unstressed plants and leaves (Ls) and roots (Rs) from 5-week-old plants stressed with 400 mm NaCl for 72 h. The northern blot was hybridized with a digoxigenin-labeled probe corresponding to the full-length AtpvE cDNA sequence. The lanes were loaded with aliquots from the same RNA preparation as used for the transcript quantitation shown in C. B, Amplification of a fragment of the coding region of AtpvE (TR) by RT-PCR. Linearity of amplification was tested in up to 24 amplification cycles in 5-week-old common ice plant. C, Quantitation of transcript amounts of V-ATPase subunit E in 3-, 5-, and 10-week-old common ice plant.
Figure 2
Figure 2
In situ hybridization and immunocytological analysis of V-ATPase subunit E in leaves of common ice plant. A, In situ hybridization in a leaf cross-section, focusing on a vascular bundle of 5-week-old control plants. Antisense. B, In situ hybridization in a leaf cross-section of 5-week-old plants stressed for 72 h. The insert shows a bladder cell from a leaf cross section of 10-week-old common ice plant treated with 400 mm NaCl for 72 h. Antisense. C, Immunolocalization in a leaf cross-section of 5-week-old control plants stressed with 400 mm NaCl for 72 h stained with preimmune serum. The green signals represent the autofluorescence of the tissue as a negative control. D, In situ hybridization to leaf cross-sections of 5-week-old plants stressed with 400 mm NaCl for 72 h. Sense probe for control of nonspecific hybridization. E, Immunolocalization of subunit E in leaves of 10-week-old control plants. Subunit E localization is shown with red fluorescence signals. F, Immunological detection of V-ATPase subunit E in 10-week-old plants stressed with 400 mm NaCl for 72 h. G, Immunolocalization of subunit E in leaves of 5-week-old control plants. On the right side, a bladder cell protrudes from the epidermis. H, Immunological detection of V-ATPase subunit E in 5-week-old plants stressed with 400 mm NaCl for 72 h.
Figure 3
Figure 3
In situ hybridization of V-ATPase subunit E to root cross-sections of control plants and plants treated with 400 mm NaCl for 72 h. A, 3-week-old plant. Cross-section about 5 cm from the tip. Control. Antisense. B, Same as A, but salt stressed. Antisense. C, 5-week-old plant. Cross-section about 200 μm from the tip. Control. Antisense. D, Same as C, but salt stressed. Antisense. E, 5-week-old plant. Cross-section about 5 cm from the tip. Control. Antisense. F, Same as E, but salt stressed. Antisense. G, Ten-week-old plant. Cross-section about 8 cm from the tip. Salt stress. Antisense. H, Ten-week-old plant. Cross-section about 8 cm from the tip. Salt stress. Sense.
Figure 4
Figure 4
Immunolocalization of V-ATPase subunit E in root cross-sections of control plants and plants treated with 400 mm NaCl for 72 h. A through F are labeled as in Figure 3. G, Ten-week-old plant. Cross-section about 8 cm from the tip. Control. H, Same as G, but salt-stressed.
Figure 5
Figure 5
Immunolocalization of V-ATPase subunit E in leaf mesophyll cells of 5-week-old control plants (A) and plants treated with 400 mm NaCl for 72 h (B). C, 5-week-old control plant stained with pre-immune serum.
Figure 6
Figure 6
Quantitation of transcript amounts of V-ATPase subunit E using a probe including the extreme 3′ end of the coding region and part of the 3′-non-translated region of the gene (NTR), of Imt1, and Ppc1 in 3-, 5-, and 10-week-old common ice plant. RNA from leaves (Lc) and roots (Rc) of unstressed plants and leaves (Ls) and roots (Rs) from plants stressed with 400 mm NaCl for 72 h was quantitated by RT-PCR. Transcripts were amplified in the linear range of amplification with 23 cycles for subunit E, Twenty-five cycles for Imt1, and 25 cycles for Ppc1. Actin served as a loading control.
Figure 7
Figure 7
Quantitation of V-ATPase subunits A, B, F, and c transcripts by RT-PCR. Template DNA was obtained from leaves (Lc) and roots (Rc) of unstressed plants and leaves (Ls) and roots (Rs) from stressed plants. Transcripts were amplified with specific primers as outlined in “Materials and Methods” in the linear range of amplification with 25 cycles for subunit A, 20 cycles for subunit B, 21 cycles for subunit E, 28 cycles for subunit F, 20 cycles for subunit c, and 25 cycles for actin.
Figure 8
Figure 8
Age-dependent sodium uptake in common ice plant. Sodium contents of roots and leaves of hydroponically grown 3-, 5-, and 10-week-old plants. Plants were grown without sodium or treated with 400 mm NaCl for 72 h (n = 6).
Figure 9
Figure 9
Pharmacological study of salt-induced expression of V-ATPase subunit E, Imt1, and Ppc1 in detached leaves of 5-week-old common ice plant. A, Intact plant stress. RT-PCR-quantitation of transcript amounts of V-ATPase subunit E, Imt1, and Ppc1 in leaves of unstressed plants (label C) and plants stressed for 6 h with 400 mm NaCl (label S). Transcripts were amplified with 21 cycles for subunit E and 25 cycles for Imt1 and Ppc1. Actin is shown as a loading control. B, Salt effect on detached leaves. Quantitation of transcript amounts of V-ATPase subunit E, Imt1, and Ppc1 in non-treated detached leaves (C) and detached leaves stressed for 6 h with 400 mm NaCl (S) as described for Figure 8A. C, Sodium concentration in leaves of non-stressed control plants (C) and in detached leaves stressed for 6 h with 400 mm NaCl (S) (n = 2). D, Pharmacological analysis of salt-induced expression. Transcript amounts of V-ATPase subunit E, Imt1, and Ppc1 were quantified in detached leaves stressed for 6 h with 400 mm NaCl (S), or with 400 mm NaCl supplemented with 20 mm EGTA/0.8 mm EGTA/AM (E), 50 μm neomycin sulfate (NM), 400 μm forskolin (FK), 10 μm mastoparan (MP), or 120 nm cholera toxin (CT). Transcripts were amplified within the linear cycle range with 21 cycles for subunit E, 20 cycles for Imt1, and 27 cycles for Ppc1.

References

    1. Adams P, Nelson DE, Yamada S, Chmara W, Jensen RG, Bohnert HJ, Griffiths H. Growth and development of Mesembryanthemum crystallinum (Aizoaceae) New Phytol. 1998;138:171–190. - PubMed
    1. Adashi EY, Resnick CE. 3′,5′-Cyclic adenosine monophosphate as an intracellular second messenger of luteinizing hormone: application of the forskolin criteria. J Cell Biochem. 1986;31:217–28. - PubMed
    1. Apse MP, Aharon GS, Snedden WA, Blumwald E. Salt tolerance conferred by overexpression of a vacuolar Na+/H+ antiport in Arabidopsis. Science. 1999;285:1256–1258. - PubMed
    1. Arai H, Terres G, Pink S, Forgac M. Topography and subunit composition of the coated vesicle proton pump. J Biol Chem. 1988;263:8796–8802. - PubMed
    1. Barkla BJ, Zingarelli L, Blumwald E, Smith JAC. Tonoplast Na+/H+ antiport activity and its energization by the vacuolar H+-ATPase in the halophytic plant Mesembryanthemum crystallinum L. Plant Physiol. 1995;109:549–556. - PMC - PubMed

Publication types

MeSH terms

Substances

LinkOut - more resources