

Review
doi: 10.1136/heart.85.5.581.
Cardiovascular magnetic resonance
Affiliations
- PMID: 11303017
- PMCID: PMC1729746
- DOI: 10.1136/heart.85.5.581
Item in Clipboard
Review
Cardiovascular magnetic resonance
Heart.
2001 May.
No abstract available
Figures
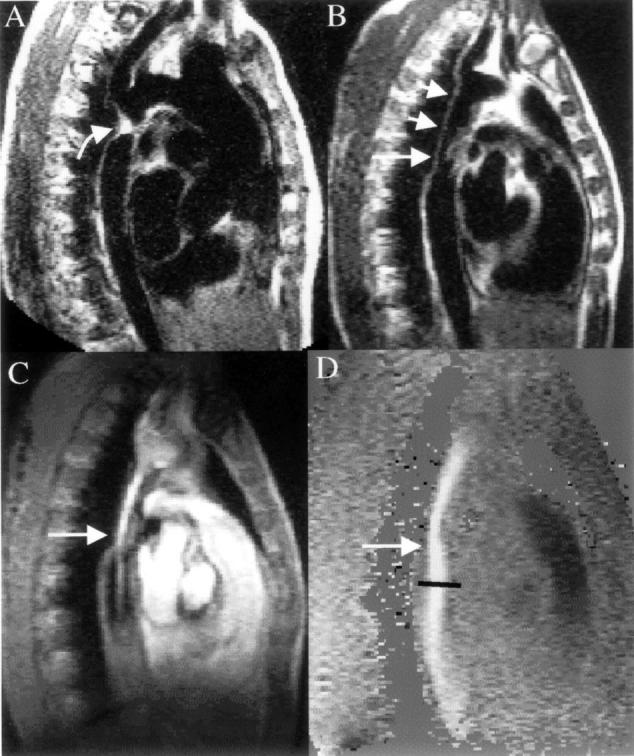
CMR in a patient with coarctation. (A) The preoperative spin echo image in an oblique sagittal plane shows the entire thoracic length of the aorta, and the coarctation (curved arrow) just distal to an enlarged left subclavian artery. (B) Appearance of the same region with spin echo imaging some years after repair of the coarctation site with a Dacron graft (short arrows). There is narrowing of the distal end of the graft and this is clearly seen in C with the systolic frame of the gradient echo cine showing bright signal within the graft from increased velocities and flow enhancement. Immediately distal to the graft narrowing (straight arrow) a bright jet is seen exiting into the normal descending aorta surrounded by dark areas which are caused by signal loss from turbulence. The velocity map D, from exactly the same plane as C, shows intense white colouration and a peak velocity measured at 3 m/s (36 mm Hg pressure gradient).
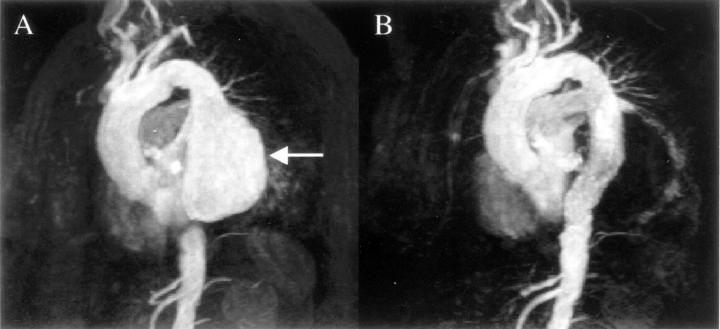
CMR three dimensional angiography of a patient with a descending aortic aneurysm (arrow) before (A), and after (B) insertion of a covered stent. The technique involves a peripheral injection of gadolinium contrast agent and data acquisition for eight seconds. Each of the images shown is one from a three dimensional data set which can be rotated to appreciate fully the anatomy, and plan the length and size of stent for this procedure. Reproduced from Stables et al, Circulation 2000;101:1888-9, with permission of the publisher.
CMR before (A) and after (B) gadolinium enhancement in a patient with an abnormal chest x ray, and symptomatic ventricular premature beats. After gadolinium a clear enhancing lesion is seen in the subendocardium of the apical septum (vertical arrow). This was a metastatic chondrosarcoma from a chest primary (angled arrow).
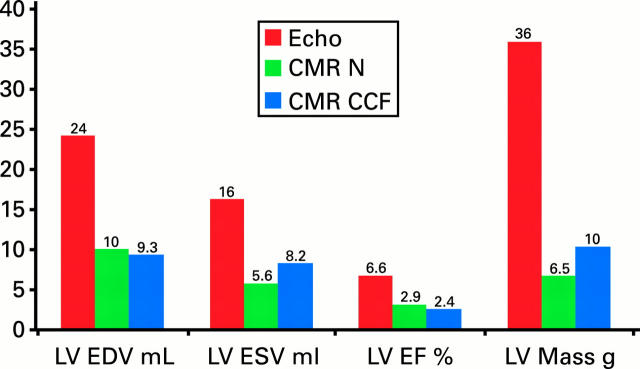
Comparison of the standard deviation of inter-study reproducibility between echocardiography and CMR. This standard deviation is central to determining sample size for drug trials. Sample size rises with the square of the ratio in standard deviations between the techniques. For all remodelling parameters of function and mass, the variability of two dimensional echocardiography is greater. The comparative figures come from different patient groups—echocardiography data from Otterstad et al, Eur Heart J 1997;18:507-13, and CMR data from Bellenger et al.11 N, normals; CCF, congestive cardiac failure; LV, left ventricle; EDV, end diastolic volume; ESV, end systolic volume; EF, ejection fraction.
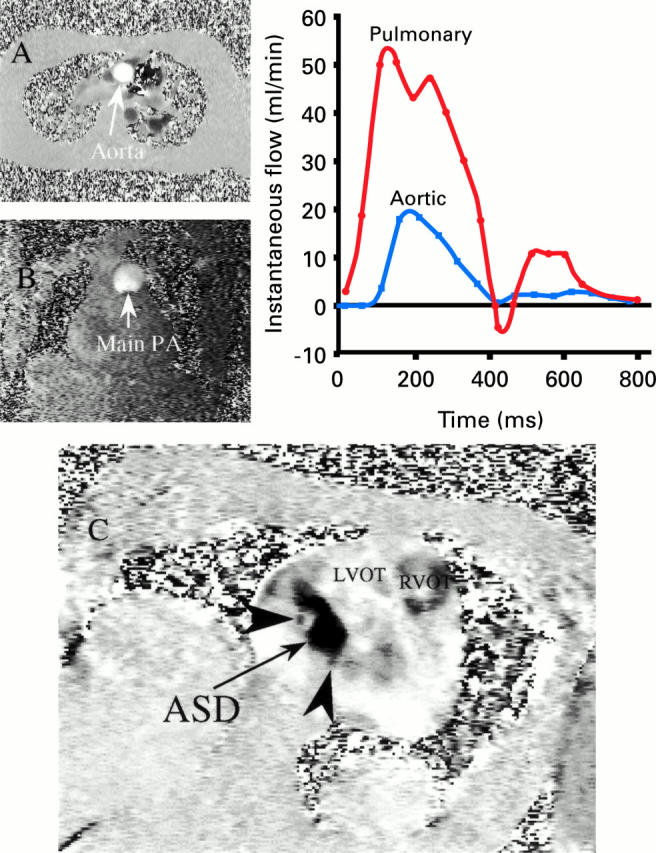
CMR of a patient with an atrial septal defect (ASD) in which conflicting echocardiographic and catheterisation results as to the size of the shunt had been obtained. (A) Velocity map (single frame) in a transverse plane for measurement of flow in the aorta; (B) velocity map (single frame) in a coronal plane for measurement of flow in the main pulmonary trunk (main PA); and graph of systemic and pulmonary flow plotted against time. The flow is calculated from the area under each curve, and the Qp:Qs ratio was 4:1 indicating a very substantial shunt. (C) Phase velocity map of the ASD viewed from the right atrium in an oblique transaxial plane (RVOT, right ventricular outflow tract; LVOT, left ventricular outflow tract). The large ASD is seen as black pixels due to transseptal flow into the right atrium, and has a maximum diameter of 3.5 cm and an area of 5.6 cm2. The arrow heads indicate adjacent fenestrations. Reproduced from Taylor et al, J Cardiovasc Magn Reson 1999;1:43-7, with permission of the publisher.
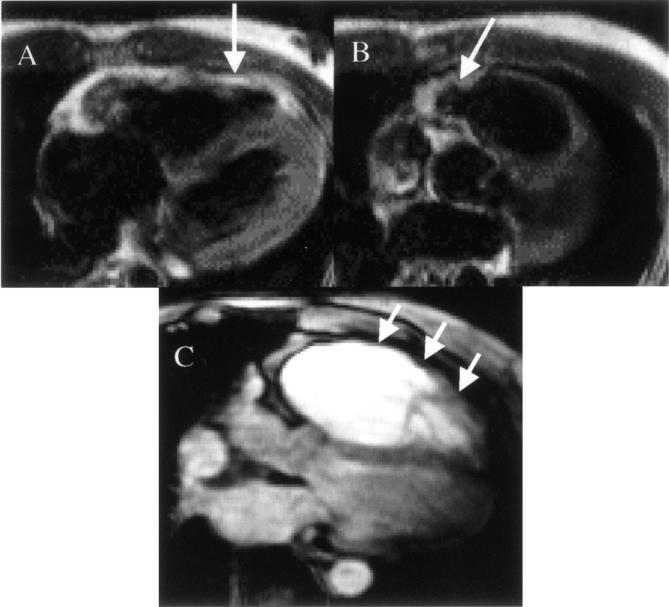
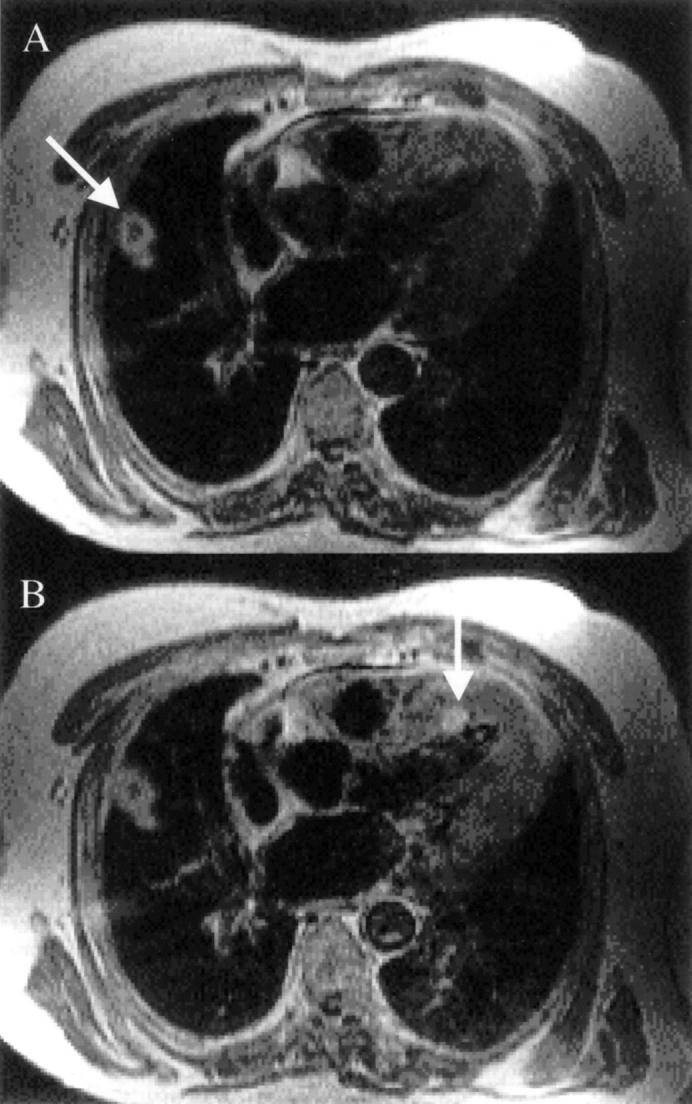
CMR features of arrhythmogenic right ventricular cardiomyopathy (ARVC). (A) A mid-ventricular transaxial plane in a patient with early disease who presented with non-sustained ventricular tachycardias of left bundle branch block morphology. The vertical arrow indicates an area of high signal in the right ventricular wall which represents fatty replacement of the myocardium. (B) In the same patient, the angled arrow shows a slightly higher transaxial plane with a bulge in the medial portion of the right ventricular outflow tract. (C) In a different patient, end stage disease is shown in the transaxial plane, with a very large right ventricle pushing the left ventricle posteriorly, and a thinned right ventricular free wall (short arrows). In general, ARVC is best diagnosed in its early stages when regional wall motion abnormalities in the right ventricle are present. In the patient in A and B, the region of fatty infiltration showed dyskinesia during systole, greatly increasing confidence in the diagnosis.
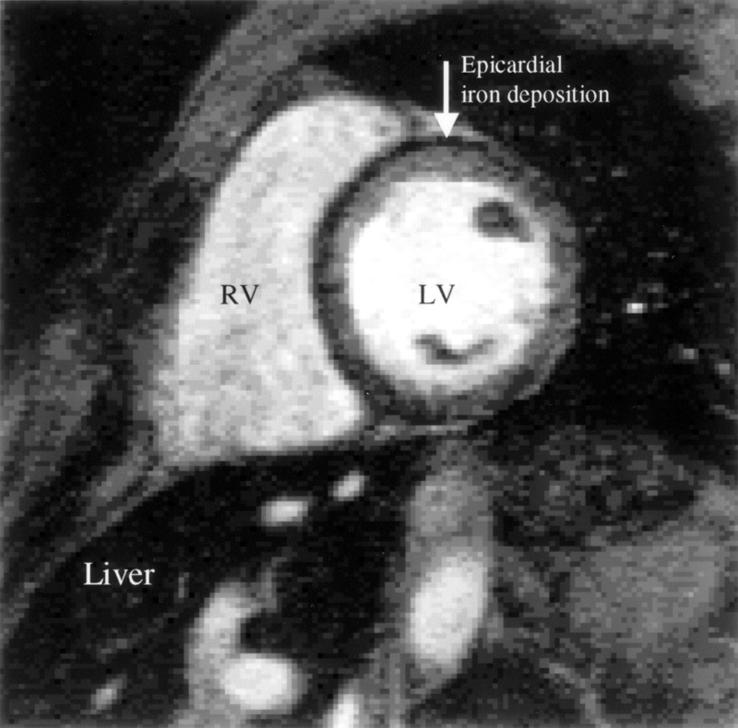
Example of iron deposition in a patient with thalassaemia. The dark epicardial rim of iron is arrowed. Note that liver deposition is very heavy, and the liver is therefore black. The signal loss occurs because of disturbances in the relaxation parameters of the tissues brought about by the iron causing alterations in the local magnetic field. There is very poor correlation between iron deposition in the liver and the heart, which prevents adequate management of the cardiac complications of myocardial iron overload (arrhythmia, heart failure, and death) from liver biopsy results. RV, right ventricle; LV, left ventricle. Reproduced from Rajappan et al, Eur J Heart Failure 2000;2:241-52, with permission of the publisher.
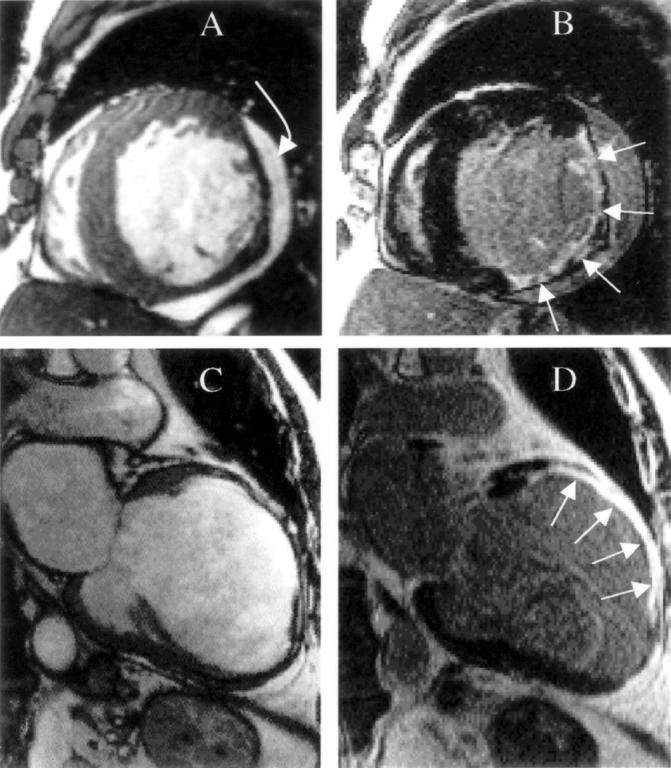
Myocardial infarction can be identified and viability can be determined using the late enhancement pattern after intravenous gadolinium. This figure shows two different patients, with the top row showing a lateral infarction, and the bottom row showing an anterior infarction. The left column (A and C) shows single frames from gradient echo cines, and the right column (B and D) shows the gadolinium enhanced images. The bright areas in B and D are infarcted tissue which is brightly enhanced (straight arrows). The infarct in the short axis plane (B) extends from the inferior wall to the anterolateral wall, and is mainly non-transmural. In particular, at 4 o'clock a significant rim of viable epicardial tissue is present and wall thickness is preserved. However, wall thinning has occurred elsewhere where the transmural extent of infarction is greater. The infarct in the anterior wall of the vertical long axis plane (D) is transmural, however, and considerably greater thinning and ventricular remodelling has taken place. This technique allows transmural high resolution infarct depiction in-vivo for the first time. The curved arrow shows a pericardial effusion. Reproduced from Rajappan et al, Eur J Heart Failure 2000;2:241-52, with permission of the publisher. Images courtesy of R Kim and R Judd.
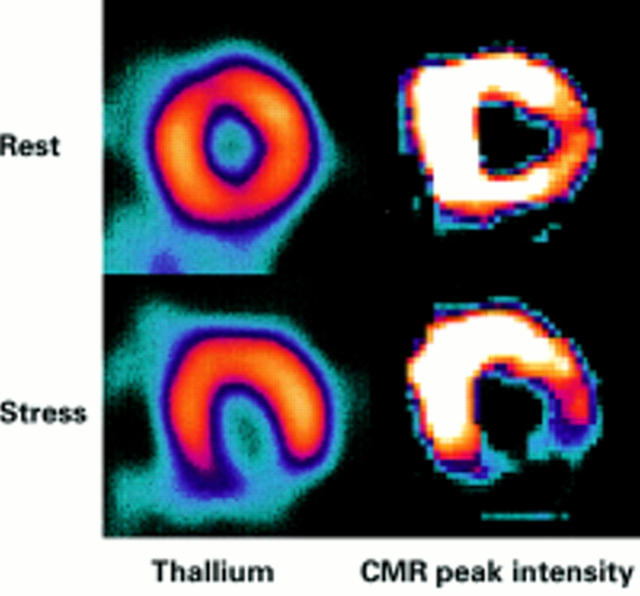
Comparison of thallium (left column) and CMR (right column) perfusion imaging in a patient with right coronary stenosis and inferior reversible ischaemia. The CMR images are parametric maps which are colour coded to appear similar to the thallium scan. Each pixel in the image represents the relative time to peak enhancement and bright colour indicates faster contrast wash-in and therefore better perfusion. The defect in the CMR scan is very similar in size and intensity to the thallium scan.
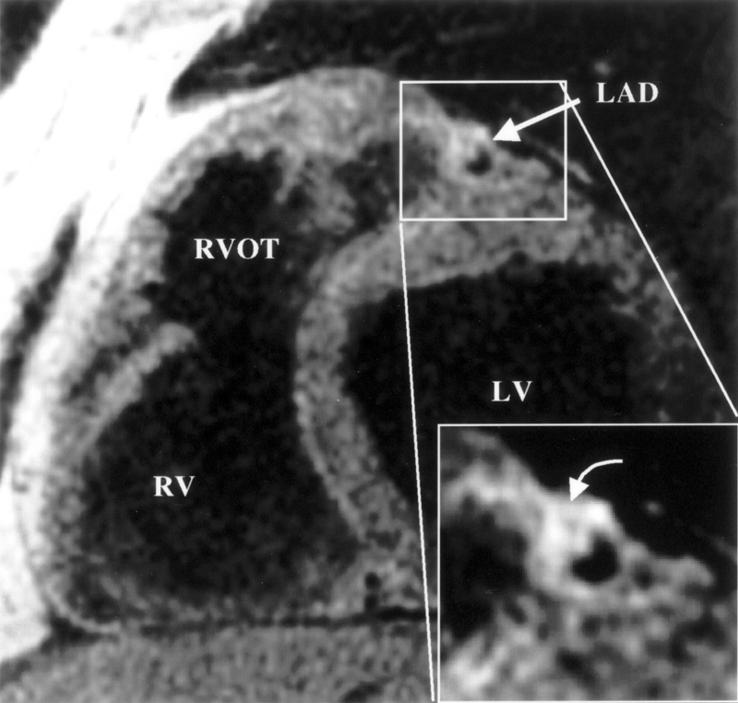
Coronary wall imaging in a patient with mild to moderate proximal left anterior descending (LAD) coronary artery stenosis. The enlargement shows eccentric vascular remodelling, as described by Glagov, with minor luminal encroachment. Note the dark area in the plaque (curved arrow). In validation studies, this represents the lipid core. Improvement in this type of imaging may lead to definition of the propensity to plaque rupture in vivo. LV, left ventricle; RV, right ventricle; RVOT, right ventricular outflow tract. Reproduced from Fayad et al, Circulation 2000;102:506-10, with permission of the publisher.
References
Publication types
MeSH terms
LinkOut - more resources
Full Text Sources
Medical