. 2001 Apr 16;193(8):881-92.
doi: 10.1084/jem.193.8.881.

Cytokines regulate proteolysis in major histocompatibility complex class II-dependent antigen presentation by dendritic cells

Affiliations

Cytokines regulate proteolysis in major histocompatibility complex class II-dependent antigen presentation by dendritic cells

E Fiebiger et al. J Exp Med. .

Abstract

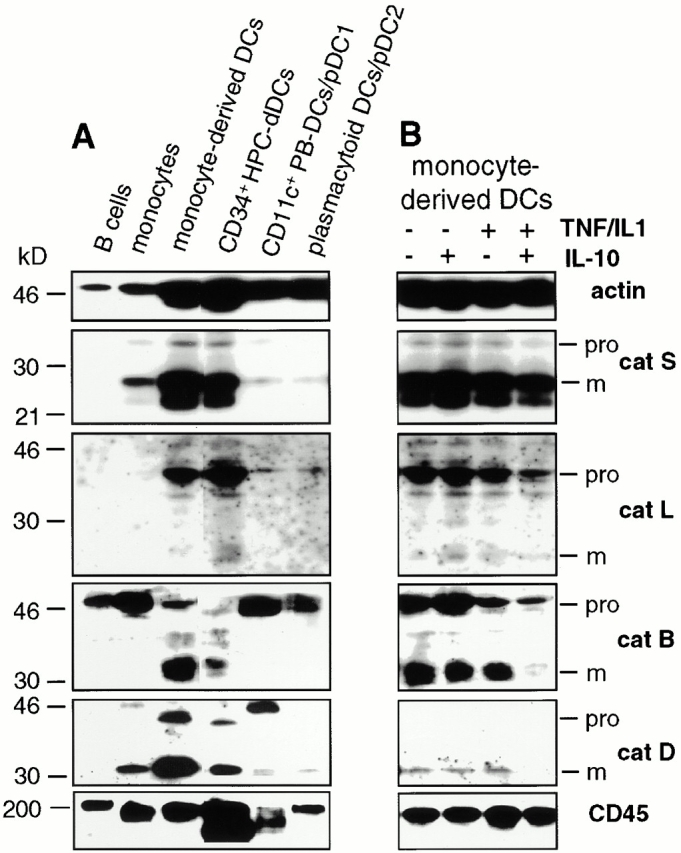
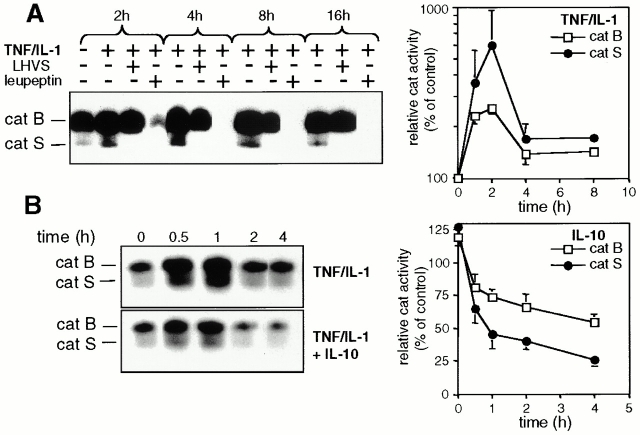
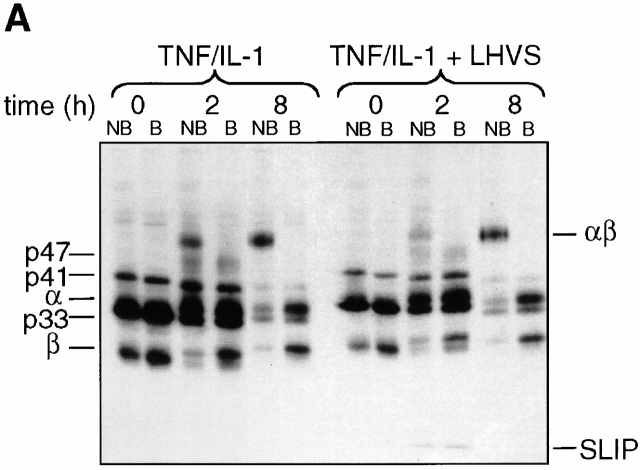
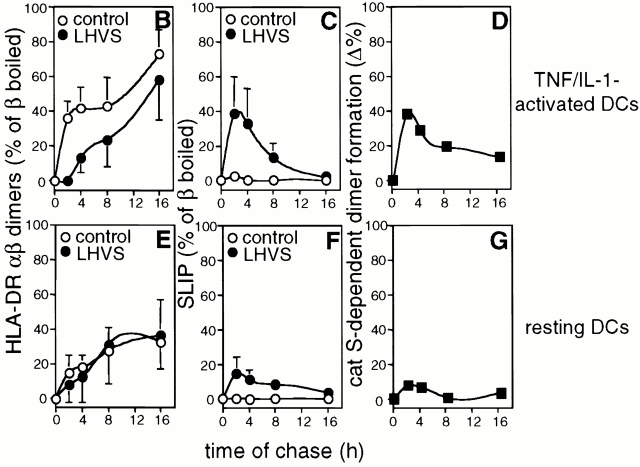
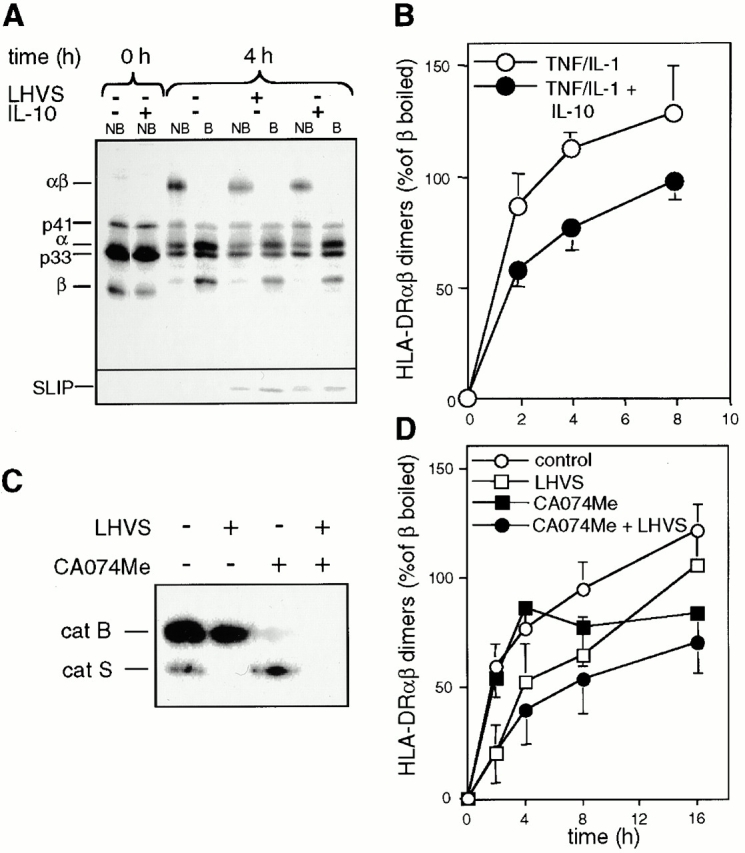
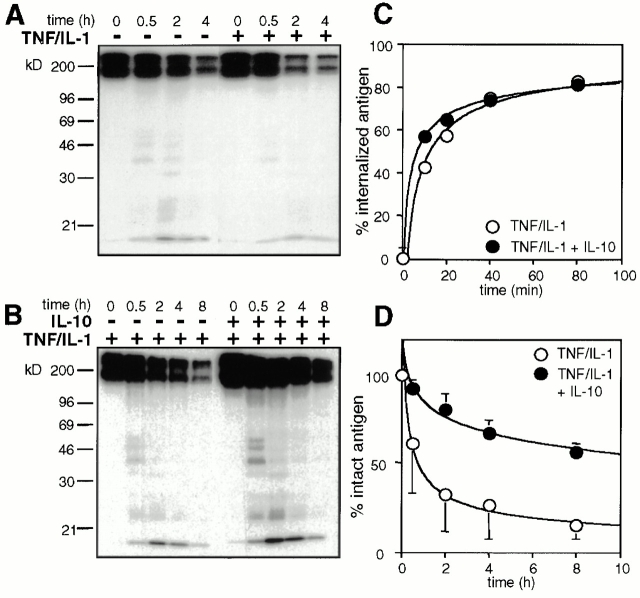
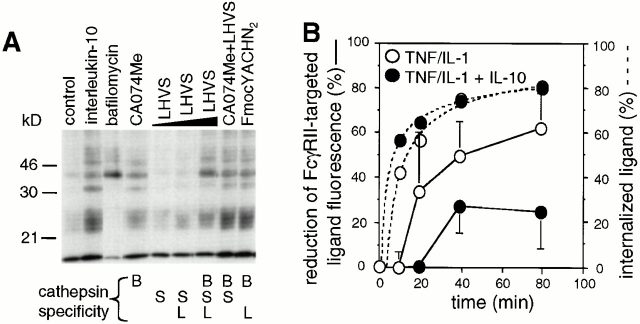
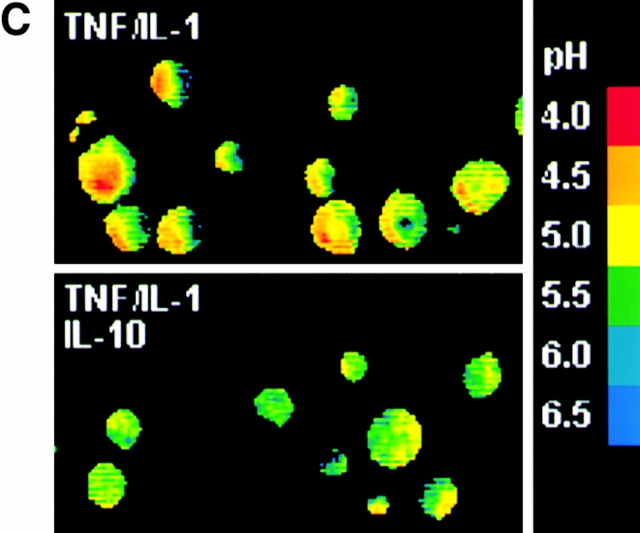
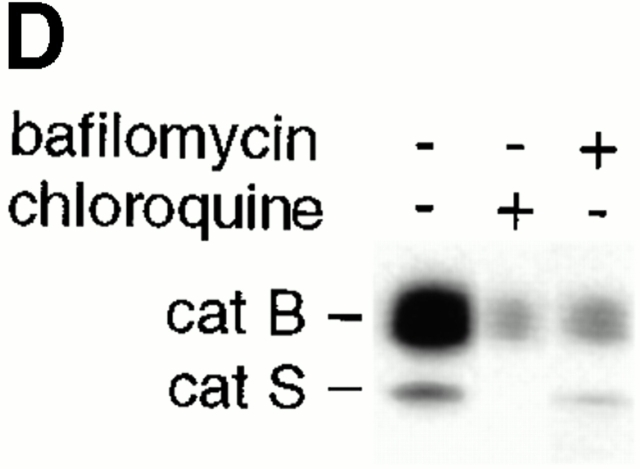
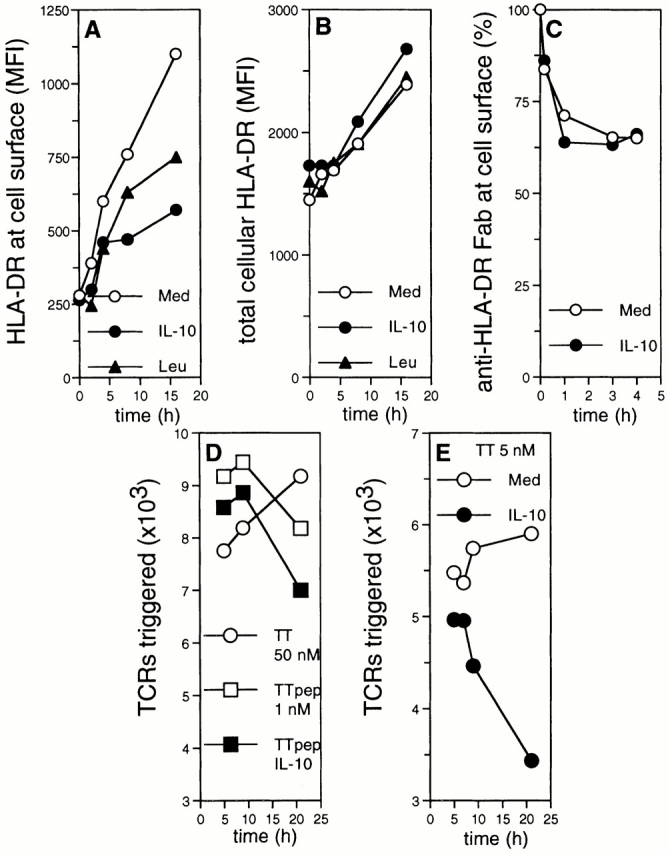
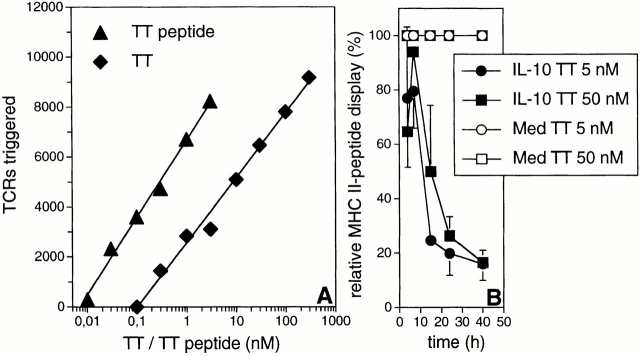
Endo/lysosomal proteases control two key events in antigen (Ag) presentation: the degradation of protein Ag and the generation of peptide-receptive major histocompatibility complex (MHC) class II molecules. Here we show that the proinflammatory cytokines tumor necrosis factor alpha and interleukin (IL)-1beta rapidly increase the activity of cathepsin (cat) S and catB in human dendritic cells (DCs). As a consequence, a wave of MHC class II sodium dodecyl sulfate stable dimer formation ensues in a catS-dependent fashion. In contrast, the antiinflammatory cytokine IL-10 renders DCs incapable of upregulating catS and catB activity and in fact, attenuates the level of both enzymes. Suppressed catS and catB activity delays MHC class II sodium dodecyl sulfate stable dimer formation and impairs Ag degradation. In DCs exposed to tetanus toxoid, IL-10 accordingly reduces the number of MHC class II-peptide complexes accessible to tetanus toxoid-specific T cell receptors, as analyzed by measuring T cell receptor downregulation in Ag-specific T cell clones. Thus, the control of protease activity by pro- and antiinflammatory cytokines is an essential feature of the Ag presentation properties of DCs.


Figures

Figure 1
Figure 1
Regulation of cat expression in DCs. (A) cat expression profile of DCs and DC precursors. NP-40 lysates of equal numbers of the indicated cell types were subjected to anti-catS, -catL, -catB, and -catD immunoblotting. Anti-actin and -CD45 reactivity was assessed for control purposes. (B) Regulation of cat expression by pro- and antiinflammatory cytokines. mdDCs were incubated with IL-10 and/or TNF/IL-1 for 24 h before immunoblotting. The positions of pro and mature (m) cats and mol wt markers (kD) are given right and left, respectively.
Figure 2
Figure 2
Reciprocal regulation of cat activity by cyto-kines. (A) Proinflammatory cytokines upregulate catS and catB activity. DCs were incubated for 4 h with or without LHVS or leupeptin and were cultured in the presence or absence of TNF/IL-1 for the indicated time periods. (Left) Autoradiography of an active-site labeling experiment. The positions of active catS and catB are indicated. (Right) Quantification of TNF/IL-1–induced catS and catB activities. Data are expressed as the mean percentage cat activity (± SEM, n = 3) in TNF/IL-1–stimulated DCs as compared with nonstimulated controls. (B) IL-10 downregulates catS and catB activity. After overnight culture in medium (left, upper gel) or in medium containing IL-10 (left, lower gel), DCs were exposed to TNF/IL-1 and analyzed for catS and catB activity. (Left) Representative autoradiography. (Right) Quantification of the IL-10–induced loss of catS and catB activity. Data are expressed as the mean percentage cat activity (± SEM, n = 3) in IL-10–treated DCs as compared with controls.
Figure 3
Figure 3
Cytokine-induced catS activity mediates efficient SDS stable class II dimer formation. (A) Metabolically labeled DCs were chased in TNF/IL-1–containing medium in the presence or absence of LHVS and subjected to anti–HLA-DR immunoprecipitation. Nonboiled (NB) and boiled (B) precipitates were analyzed by SDS-PAGE. The positions of free HLA-DR-α (α) and β chains (β), Ii isoforms (p33, p41, p47), SDS stable HLA-DR-αβ dimers (αβ), and LHVS-induced SLIP are indicated. (B–G) Pulse-chase immunoprecipitation experiments from TNF/IL-1–stimulated (B–D) and resting DCs (E and F) in the presence (•) or absence of LHVS (○). The radioactivity incorporated into SDS stable dimers (B and E) or into SLIP (C and F) is expressed as the percent of the total HLA-DR-β–bound radioactivity (ordinate; mean % ± SEM, n = 3). (D and G) catS-dependent class II dimer formation expressed as the difference between the SDS stable dimers in control and LHVS-treated cells (ordinate). Abscissa shows the chase time.
Figure 3
Figure 3
Cytokine-induced catS activity mediates efficient SDS stable class II dimer formation. (A) Metabolically labeled DCs were chased in TNF/IL-1–containing medium in the presence or absence of LHVS and subjected to anti–HLA-DR immunoprecipitation. Nonboiled (NB) and boiled (B) precipitates were analyzed by SDS-PAGE. The positions of free HLA-DR-α (α) and β chains (β), Ii isoforms (p33, p41, p47), SDS stable HLA-DR-αβ dimers (αβ), and LHVS-induced SLIP are indicated. (B–G) Pulse-chase immunoprecipitation experiments from TNF/IL-1–stimulated (B–D) and resting DCs (E and F) in the presence (•) or absence of LHVS (○). The radioactivity incorporated into SDS stable dimers (B and E) or into SLIP (C and F) is expressed as the percent of the total HLA-DR-β–bound radioactivity (ordinate; mean % ± SEM, n = 3). (D and G) catS-dependent class II dimer formation expressed as the difference between the SDS stable dimers in control and LHVS-treated cells (ordinate). Abscissa shows the chase time.
Figure 4
Figure 4
Role of IL-10 and catB for SDS stable class II dimer formation. (A and B) IL-10 delays SDS stable dimer formation. DCs cultured in the presence or absence of LHVS for 4 h or IL-10 (overnight) were stimulated with TNF/IL-1 for 4 h, metabolically labeled, and chased under prelabeling culture conditions. Immunoprecipitated class II complexes were analyzed by SDS-PAGE. (A) Representative autoradiography. (B) Quantification of SDS stable dimer formation in IL-10–treated (•) and control DCs (○). The radioactivity incorporated into SDS stable dimers is expressed as the percent of the total HLA-DR-β–bound radioactivity (ordinate; mean % ± SEM, n = 3). Abscissa gives the chase time. (C) Selective elimination of catS and/or catB activity in DCs. DCs were incubated with or without LHVS, CA074Me, or both inhibitors for 4 h. cat activity was analyzed using CBz-125I-Tyr-Ala-CN2. The inhibition profile remained constant for >16 h (data not shown). (D) catB activity contributes to SDS stable dimer formation. DCs were exposed to LHVS (□), CA074Me (▪), the combination of both (•), or medium only (○) and stimulated with TNF/IL-1 for 4 h and then subjected to pulse-chase immunoprecipitation as described. The radioactivity incorporated into SDS stable dimers is expressed as the percentage of the total HLA-DR-β–bound radioactivity (ordinate; mean % ± SEM, n = 3). Abscissa gives the chase time.
Figure 5
Figure 5
IL-10 inhibits Ag degradation but not Ag uptake. (A–D) DCs were cultured in the presence or absence of IL-10 overnight. When indicated, DCs were stimulated with TNF/IL-1 for 4 h. Cells were exposed to anti-FcγRII mAbs followed by 125I-labeled goat anti–mouse IgG (A and B) or biotinylated anti-FcγRII mAbs followed by goat anti–mouse F(ab′)2 at 4°C (C) and chased under prelabeling conditions. The degradation of iodinated IgG was followed by nonreducing 10% SDS-PAGE (A and B). Mol wt markers in kD on the left. (C) The internalization of biotinylated IgG via FcγRII was assessed by SA-PE labeling and FACS®. The percentage of Ag internalized (ordinate) by IL-10–treated (•) and control DCs (○) (mean percentage of two experiments) is depicted as a function of the chase time (abscissa). (D) Quantification of [125I]IgG degradation by IL-10–treated (•) and control DCs (○). The percentage of intact IgG (ordinate) is depicted as a function of the processing time (abscissa; mean % ± SEM, n = 3).
Figure 6
Figure 6
IL-10 inhibits catB-mediated Ag degradation and modulates the pH of endocytic DC compartments. (A) IL-10 inhibits Ag degradation by inhibiting catB activity. DCs were cultured in the presence or absence of IL-10 overnight or were exposed for 4 h to bafilomycin, CA074Me, LHVS (5, 50, or 200 nM; indicated by the wedge), CA074Me plus LHVS (5 nM), or FmocYACHN2 in the presence of TNF/IL-1. Next DCs were labeled with anti-FcγRII/125I-goat anti–mouse IgG and allowed to process Ag for 2 h at 37°C. The fragmentation pattern of [125I]IgG in the ≤ 65-kD range is shown. (B) Internalized immune complexes experience a less acidic milieu in DCs exposed to IL-10. DCs cultured in the presence (•) or absence of IL-10 (○) were exposed to TNF/IL-1 for 4 h. Then cells were labeled with biotinylated anti-FcγRII and goat anti–mouse F(ab′)2, or with FcγRII followed by FITC- or OG-labeled goat anti–mouse F(ab′)2, and chased under prelabeling conditions for the indicated time peroids (abscissa). On the ordinate, the percentage of the ligand internalization (broken lines; mean, n = 2) and of the pH-dependent reduction of ligand fluorescence (solid lines; mean ± SEM, n = 3) is shown. (C) IL-10 increases the pH of endocytic DC compartments. DCs were loaded with LysoSensor™-coupled dextran in the presence or absence of IL-10 overnight and then exposed to TNF/IL-1 for 6 h. The endosomal pH of DCs either exposed (lower) or not exposed to IL-10 (upper) was determined microscopically and is shown in a pH color code. (D) catB and S activity is downregulated by reagents that raise endosomal pH. DCs were cultured for 4 h in the presence or absence of bafilomycin, or chloroquine in TNF/IL-1–supplemented medium, and subjected to active-site labeling. Positions of catS and catB are shown.
Figure 6
Figure 6
IL-10 inhibits catB-mediated Ag degradation and modulates the pH of endocytic DC compartments. (A) IL-10 inhibits Ag degradation by inhibiting catB activity. DCs were cultured in the presence or absence of IL-10 overnight or were exposed for 4 h to bafilomycin, CA074Me, LHVS (5, 50, or 200 nM; indicated by the wedge), CA074Me plus LHVS (5 nM), or FmocYACHN2 in the presence of TNF/IL-1. Next DCs were labeled with anti-FcγRII/125I-goat anti–mouse IgG and allowed to process Ag for 2 h at 37°C. The fragmentation pattern of [125I]IgG in the ≤ 65-kD range is shown. (B) Internalized immune complexes experience a less acidic milieu in DCs exposed to IL-10. DCs cultured in the presence (•) or absence of IL-10 (○) were exposed to TNF/IL-1 for 4 h. Then cells were labeled with biotinylated anti-FcγRII and goat anti–mouse F(ab′)2, or with FcγRII followed by FITC- or OG-labeled goat anti–mouse F(ab′)2, and chased under prelabeling conditions for the indicated time peroids (abscissa). On the ordinate, the percentage of the ligand internalization (broken lines; mean, n = 2) and of the pH-dependent reduction of ligand fluorescence (solid lines; mean ± SEM, n = 3) is shown. (C) IL-10 increases the pH of endocytic DC compartments. DCs were loaded with LysoSensor™-coupled dextran in the presence or absence of IL-10 overnight and then exposed to TNF/IL-1 for 6 h. The endosomal pH of DCs either exposed (lower) or not exposed to IL-10 (upper) was determined microscopically and is shown in a pH color code. (D) catB and S activity is downregulated by reagents that raise endosomal pH. DCs were cultured for 4 h in the presence or absence of bafilomycin, or chloroquine in TNF/IL-1–supplemented medium, and subjected to active-site labeling. Positions of catS and catB are shown.
Figure 7
Figure 7
IL-10 inhibits export and display of class II–peptide complexes. (A and B) IL-10 inhibits export but not synthesis of class II. DCs were cultured overnight in the presence of IL-10 (•), leupeptin (▴), or medium only (○), and then stimulated with TNF/IL-1. Intact (A) and permeabilized cells (B) were subjected to anti–HLA-DR immunolabeling. Specific MFI (ordinate) are plotted against the time of TNF/IL-1 stimulation (abscissa). (C) Internalization of class II from the cell surface is not altered by IL-10. DCs cultured in the presence (•) or absence of IL-10 (○) were exposed to TNF/IL-1 for 4 h. Cells were labeled with biotinylated anti–HLA-DR Fab and chased under prelabeling culture conditions. The percentage of biotinylated mAb remaining at the cell surface is shown (ordinate) as the function of time (abscissa). (D and E) IL-10 inhibits the long-term display of full protein-derived, class II–associated peptides. DCs cultured in the presence (closed symbols) or absence of IL-10 (open symbols) were exposed to TNF/IL-1 for 4 h. Cells were pulsed with TT (50 and 5 nM; circles in D and E, respectively) or 1 nM TT peptide (TTpep; squares in D) and chased under prepulsing culture conditions. During the last 4 h, cells were cocultured with TT-specific T cells. The absolute numbers of triggered TCRs (ordinate) are plotted against the time of processing (abscissa). Representative experiment (n = 4).
Figure 8
Figure 8
Quantification of the TCR signaling deficit imposed by IL-10. (A) The numbers of triggered TCRs and the logarithm of the concentration of pulsed Ag are correlated in a linear fashion. Short-term TNF/IL-1–stimulated DCs were pulsed with TT (▪) or TT peptide (▴) at the indicated concentrations (abscissa). Cells were cultured for 8 h under prepulsing conditions and TT-dependent TCR triggering (ordinate) was assessed. The linear regression analysis for TT and TT peptide is shown. (B) IL-10 modulates the magnitude and duration of the TCR signal. DCs either exposed to IL-10 (closed symbols) or not exposed (open symbols) were pulsed with 5 nM (circles) or 50 nM TT (squares), and chased for the indicated time periods (abscissa). The ordinate shows the display of MHC class II–peptide complexes by IL-10-modified DCs (DC10; mean % ± SEM, n = 3) relative to control DCs (DCCO). The relative numbers of MHC class II–peptide complexes transported to the cell surface was calculated using the formula: relative class II–peptide display = [e(TCRs triggered by DC10)/e(TCRs triggered by DCCO)] 1/K. K is the constant defining the slope of the regression curve describing the correlation between the concentration of pulsed Ag and the number of triggered TCRs. K is not influenced by IL-10 (data not shown).

Similar articles

Cited by

References

    1. Cella M., Engering A., Pinet V., Pieters J., Lanzavecchia A. Inflammatory stimuli induce accumulation of MHC class II complexes on dendritic cells. Nature. 1997;388:782–787. - PubMed
    1. Cella M., Sallusto F., Lanzavecchia A. Origin, maturation and antigen presenting function of dendritic cells. Curr. Opin. Immunol. 1997;9:10–16. - PubMed
    1. Banchereau J., Steinman R.M. Dendritic cells and the control of immunity. Nature. 1998;392:245–252. - PubMed
    1. Morel A.S., Quaratino S., Douek D.C., Londei M. Split activity of interleukin-10 on antigen capture and antigen presentation by human dendritic cellsdefinition of a maturative step. Eur. J. Immunol. 1997;27:26–34. - PubMed
    1. Villadangos J.A., Ploegh H.L. Proteolysis in MHC class II antigen presentationwho's in charge? Immunity. 2000;12:233–239. - PubMed

Publication types

MeSH terms