

A simple model based on mutation and selection explains trends in codon and amino-acid usage and GC composition within and across genomes
- PMID: 11305938
- PMCID: PMC31479
- DOI: 10.1186/gb-2001-2-4-research0010
A simple model based on mutation and selection explains trends in codon and amino-acid usage and GC composition within and across genomes
Abstract
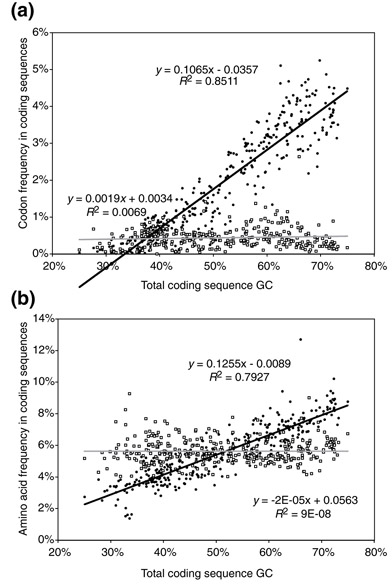
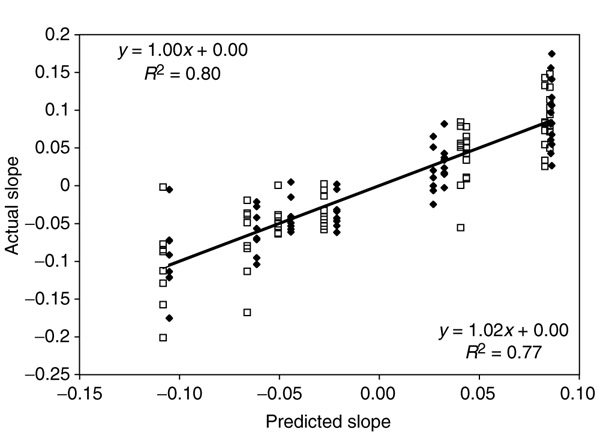
Background: Correlations between genome composition (in terms of GC content) and usage of particular codons and amino acids have been widely reported, but poorly explained. We show here that a simple model of processes acting at the nucleotide level explains codon usage across a large sample of species (311 bacteria, 28 archaea and 257 eukaryotes). The model quantitatively predicts responses (slope and intercept of the regression line on genome GC content) of individual codons and amino acids to genome composition.
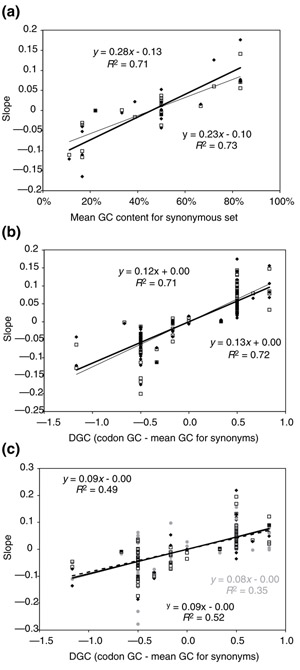
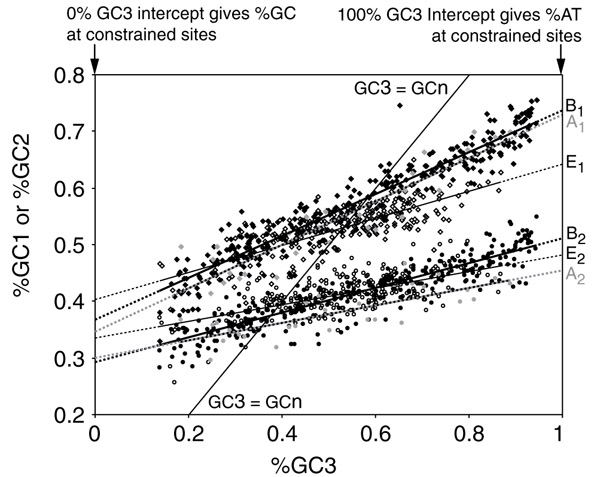
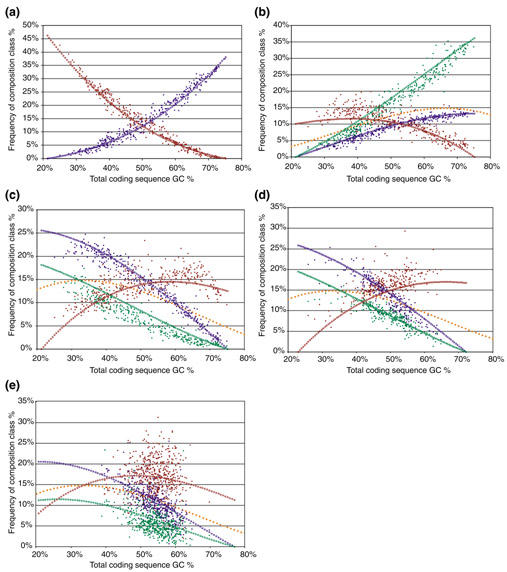
Results: Codons respond to genome composition on the basis of their GC content relative to their synonyms (explaining 71-87% of the variance in response among the different codons, depending on measure). Amino-acid responses are determined by the mean GC content of their codons (explaining 71-79% of the variance). Similar trends hold for genes within a genome. Position-dependent selection for error minimization explains why individual bases respond differently to directional mutation pressure.
Conclusions: Our model suggests that GC content drives codon usage (rather than the converse). It unifies a large body of empirical evidence concerning relationships between GC content and amino-acid or codon usage in disparate systems. The relationship between GC content and codon and amino-acid usage is ahistorical; it is replicated independently in the three domains of living organisms, reinforcing the idea that genes and genomes at mutation/selection equilibrium reproduce a unique relationship between nucleic acid and protein composition. Thus, the model may be useful in predicting amino-acid or nucleotide sequences in poorly characterized taxa.
Figures
Similar articles
-
Across bacterial phyla, distantly-related genomes with similar genomic GC content have similar patterns of amino acid usage.PLoS One. 2011 Mar 10;6(3):e17677. doi: 10.1371/journal.pone.0017677. PLoS One. 2011. PMID: 21423704 Free PMC article.
-
The genome of Campylobacter jejuni: codon and amino acid usage.APMIS. 2003 Jun;111(6):605-18. doi: 10.1034/j.1600-0463.2003.1110603.x. APMIS. 2003. PMID: 12969016
-
Thermophilic prokaryotes have characteristic patterns of codon usage, amino acid composition and nucleotide content.Gene. 2003 Oct 23;317(1-2):39-47. doi: 10.1016/s0378-1119(03)00660-7. Gene. 2003. PMID: 14604790
-
Main Factors Shaping Amino Acid Usage Across Evolution.J Mol Evol. 2023 Aug;91(4):382-390. doi: 10.1007/s00239-023-10120-5. Epub 2023 Jun 1. J Mol Evol. 2023. PMID: 37264211 Review.
-
Codon usage and codon pair patterns in non-grass monocot genomes.Ann Bot. 2017 Nov 28;120(6):893-909. doi: 10.1093/aob/mcx112. Ann Bot. 2017. PMID: 29155926 Free PMC article. Review.
Cited by
-
Codon usage bias in prokaryotic pyrimidine-ending codons is associated with the degeneracy of the encoded amino acids.Nucleic Acids Res. 2012 Aug;40(15):7074-83. doi: 10.1093/nar/gks348. Epub 2012 May 11. Nucleic Acids Res. 2012. PMID: 22581775 Free PMC article.
-
Investigating the predictability of essential genes across distantly related organisms using an integrative approach.Nucleic Acids Res. 2011 Feb;39(3):795-807. doi: 10.1093/nar/gkq784. Epub 2010 Sep 24. Nucleic Acids Res. 2011. PMID: 20870748 Free PMC article.
-
Effects of Arbovirus Multi-Host Life Cycles on Dinucleotide and Codon Usage Patterns.Viruses. 2019 Jul 12;11(7):643. doi: 10.3390/v11070643. Viruses. 2019. PMID: 31336898 Free PMC article. Review.
-
The coexistence of the nucleosome positioning code with the genetic code on eukaryotic genomes.Nucleic Acids Res. 2009 Oct;37(19):6466-76. doi: 10.1093/nar/gkp689. Epub 2009 Aug 21. Nucleic Acids Res. 2009. PMID: 19700771 Free PMC article.
-
From local structure to a global framework: recognition of protein folds.J R Soc Interface. 2014 Apr 16;11(95):20131147. doi: 10.1098/rsif.2013.1147. Print 2014 Jun 6. J R Soc Interface. 2014. PMID: 24740960 Free PMC article. Review.
References
-
- Sueoka N. Compositional correlation between deoxyribonucleic acid and protein. Cold Spring Harb Symp Quant Biol. 1961;26:35–43. - PubMed
-
- CUTG (Codon Usage Tabulated from GenBank) http://www.kazusa.or.jp/codon
MeSH terms
Substances
LinkOut - more resources
Full Text Sources
Miscellaneous
