Review
. 2001;3(3):158-75.
doi: 10.1186/bcr291. Epub 2001 Mar 20.

Applications of microarray technology in breast cancer research

Affiliations
Review

Applications of microarray technology in breast cancer research

C S Cooper. Breast Cancer Res. 2001.

Abstract

Microarrays provide a versatile platform for utilizing information from the Human Genome Project to benefit human health. This article reviews the ways in which microarray technology may be used in breast cancer research. Its diverse applications include monitoring chromosome gains and losses, tumour classification, drug discovery and development, DNA resequencing, mutation detection and investigating the mechanism of tumour development.


Figures

Figure 1
Figure 1
Filter microarrays hybridised to [α-33P]-labelled cDNA probes prepared from 50-100 ng of poly(A)+ mRNA from a human cell line before (a) and after (b) treatment with 17-allylamino-17-demethoxygeldanamycin (17-AAG). Hybridisation signals were detected by phosphorimaging and a pseudo-coloured intensity output is shown in (c). Red is expression increased by 17-AAG treatment; green, expression decreased by 17-AAG treatment. Figure provided by Paul Clarke.
Figure 2
Figure 2
Construction of Affymetrix arrays. Modified from [17]. P is the protecting group.
Figure 3
Figure 3
Comparative genomic hybridisation (CGH) on human cDNA clones microarrayed onto a glass slide. The slide was hybridised simultaneously to normal DNA (green) and DNA from a breast cancer cell line (red). (a) Complete array of 6,000 cDNAs; (b) magnified region of the array showing the CERBB2 gene (arrow). The red colour of this array point indicates that the CERBB2 gene is amplified. Figure provided by Jeremy Clark.
Figure 4
Figure 4
Classification of tumours on the basis of microarray expression profiles. (a) Dendrogram showing hierarchical clustering based on expression data from a set of 1,164 cDNAs measured across 64 cell lines. (b) A coloured representation of the data rows (genes) and columns (cell lines) in cluster order. The colour in each cell of the table represents the mean-adjusted expression level of the gene, with green showing underexpression and red indicating overexpression according to the chart in (b). The labels 3a-3d refer to clusters of genes for leukaemias (3a), epithelial tumours (3b), melanoma (3c) and mesenchymal tumours (3d). Published with permission from Nature Genetics [32].
Figure 5
Figure 5
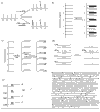
Strategies for DNA sequencing. (a) Gain-of-hybridisation approach: an array is hybridised to normal DNA which has the base T at the position under interrogation or to test DNA containing a heterozygous T→G mutation. (b) Loss-of-hybridisation approach: in this example the array is hybridised to a mixture of normal DNA (solid bars) and DNA containing a mutation (open bars). The mutation is detected by its inability to hybridise at oligonucleotide positions that do hybridise to normal control DNA sequences. (c) Minisequencing: an array containing oligonucleotides attached at their 5' ends is hybridised to the target DNA and then incubated with a mixture of fluorescently tagged dideoxynucleoside triphosphates (ddNTP*) and DNA polymerase. Covalent attachment of the tagged ddNTP* is only possible if it complements the target sequence. (d) Universal array sequencing: the target sequence is hybridised to upstream LDR primers attached to 'zip code' sequences (Z1, Z2, etc) and to a downstream LDR primer containing a fluorescent tag. The two primers are only joined if the correct base pairing is present at the junction. (e) The ligated mixture is then hybridised to a universal array containing sequences complementing the 'zip codes'.
Figure 6
Figure 6
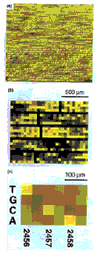
The use of an Affymetrix DNA microarray to sequence the BRCA1 gene. The array is hybridised with a mixture of normal DNA (green) and test DNA from a carrier of the BRCA1 mutation (red). Equal hybridisation to the two probes gives yellow. (a) Composite image of hybridisation to normal control and test DNA. (b) Magnification of the region surrounding the 2,457 C→T mutation. (c) Close-up of the probe sets surrounding the 2,457 C→T mutation. The bright red signal indicates the presence of the mutation. Taken from [42].

References

    1. Bassett DE, Eisen MB, Boguski MS. Gene expression informatics - its all in your mine. Nat Genet. 1999;21 (suppl):51–55. - PubMed
    1. Ramsay G. DNA chips: state-of-the-art. Nat Biotechnol. 1998;16:40–44. - PubMed
    1. Chee M, Yang R, Hubbel E, Berno A, Huang XC, Stern D, Winkler J, Lockhart DJ, Morris MS, Fodor SP. Accessing genetic information with high-density DNA arrays. Science. 1996;274:610–614. - PubMed
    1. Lockhart DJ, Dong H, Byrne MC, Follettie MT, Gallo MV, Chee MS, Mittman M, Wang C, Kobayashi M, Horton H, Brown EL. Expression monitoring by hybridisation to high-density oligonucleotide arrays. Nat Biotechnol. 1996;14:1675–1680. - PubMed
    1. Lipshutz RJ, Fodor SPA, Gingeras TR, Lockhart DJ. High density synthetic oligonucleotide arrays. Nat Genet. 1999;21 (suppl):20–24. - PubMed