. 2001 Apr 15;21(8):2610-21.
doi: 10.1523/JNEUROSCI.21-08-02610.2001.

The homeostatic regulation of sleep need is under genetic control

Affiliations

The homeostatic regulation of sleep need is under genetic control

P Franken et al. J Neurosci. .

Abstract

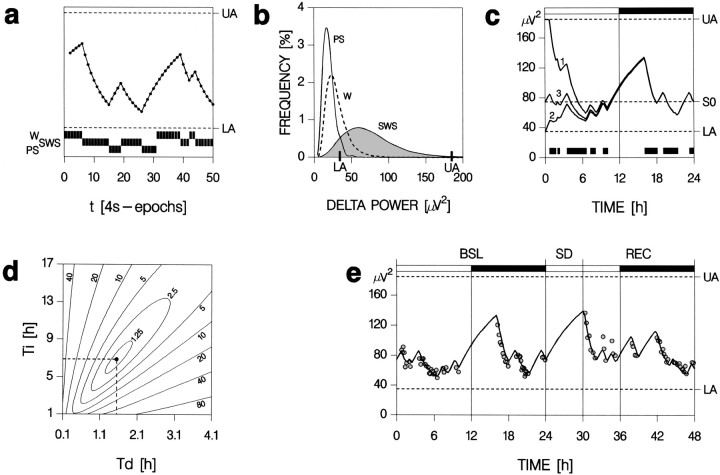
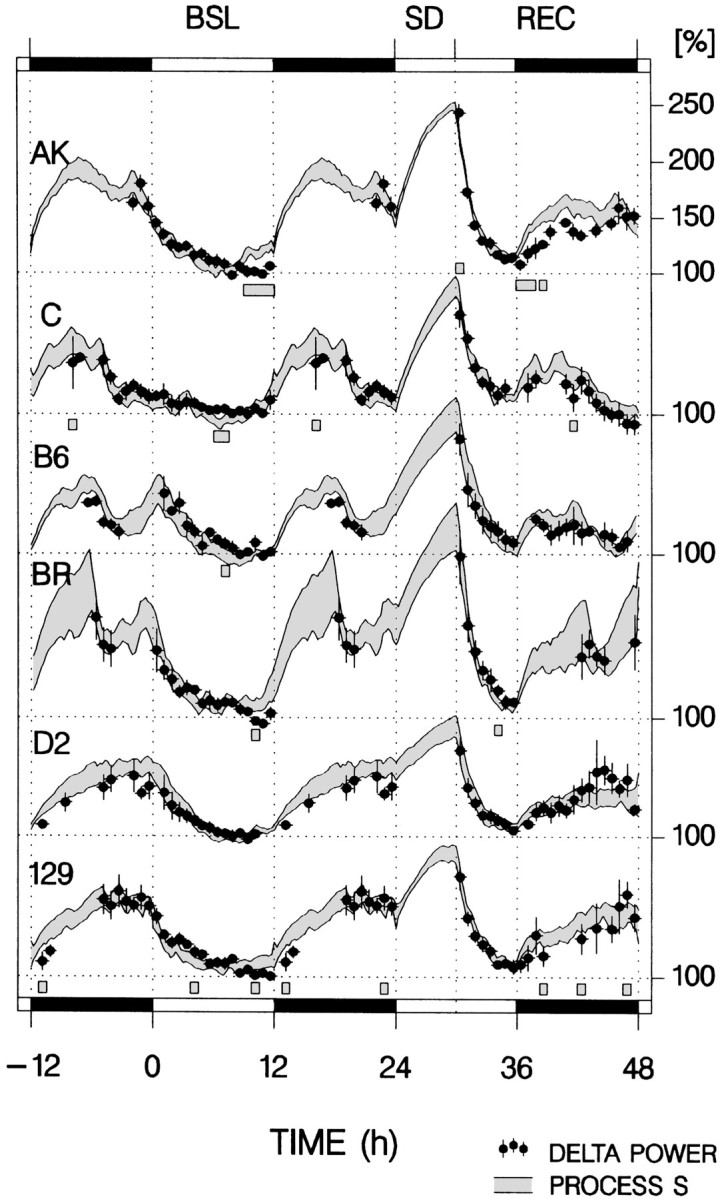
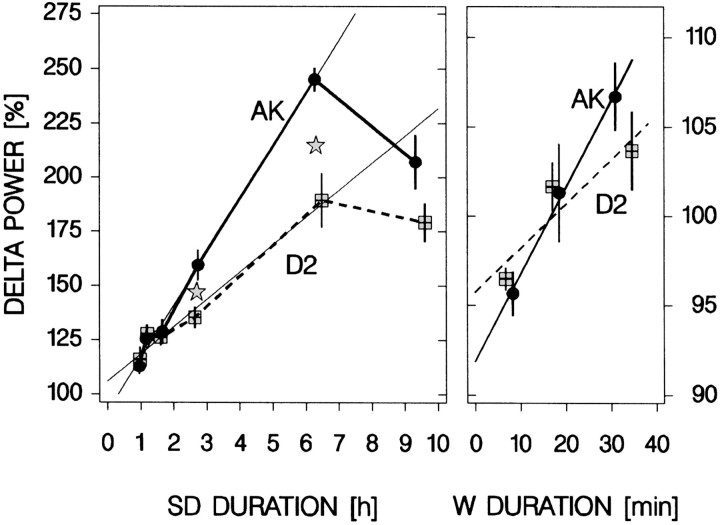
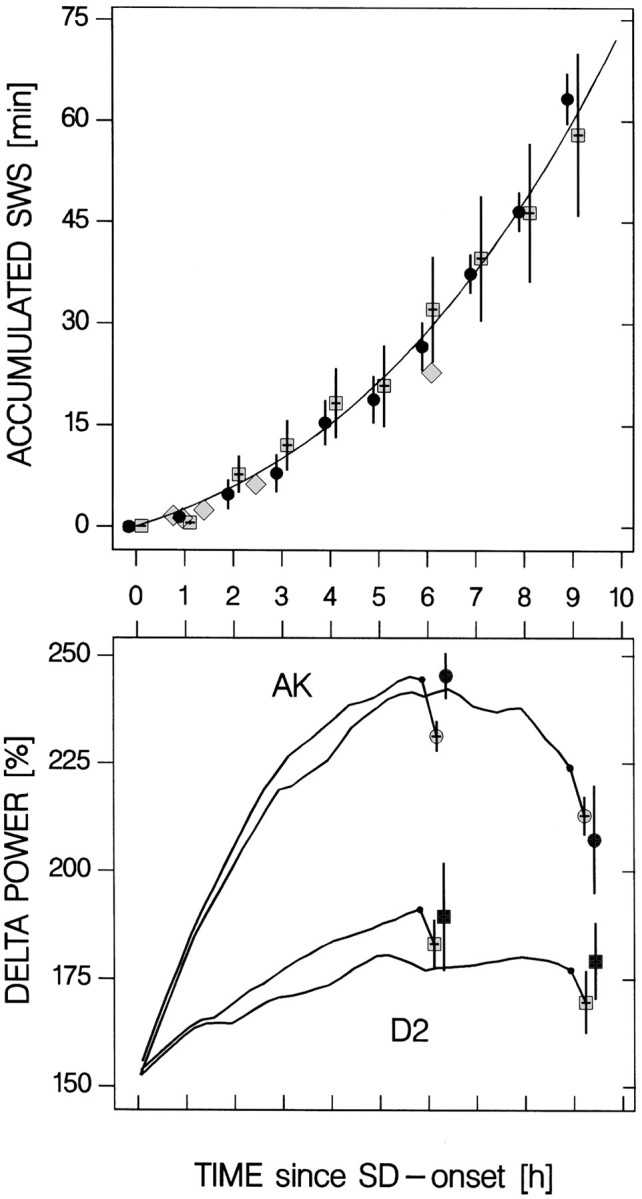
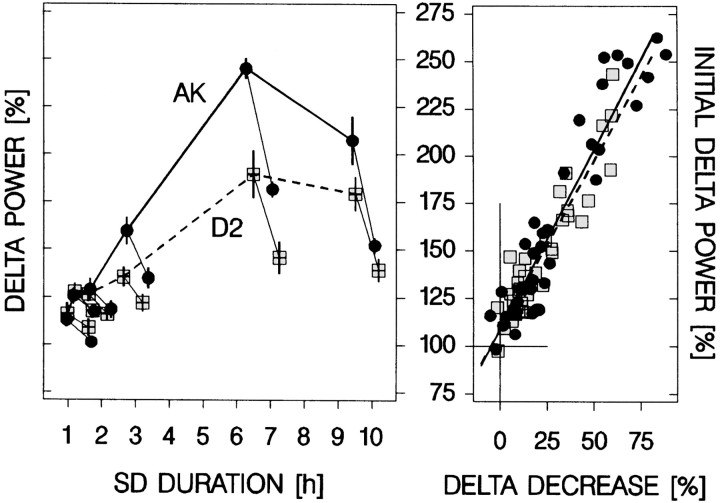
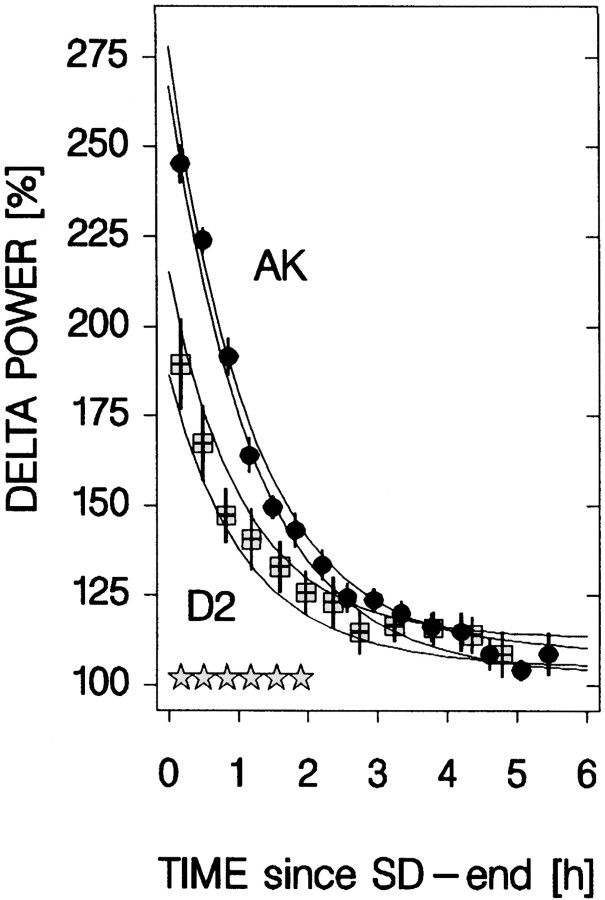
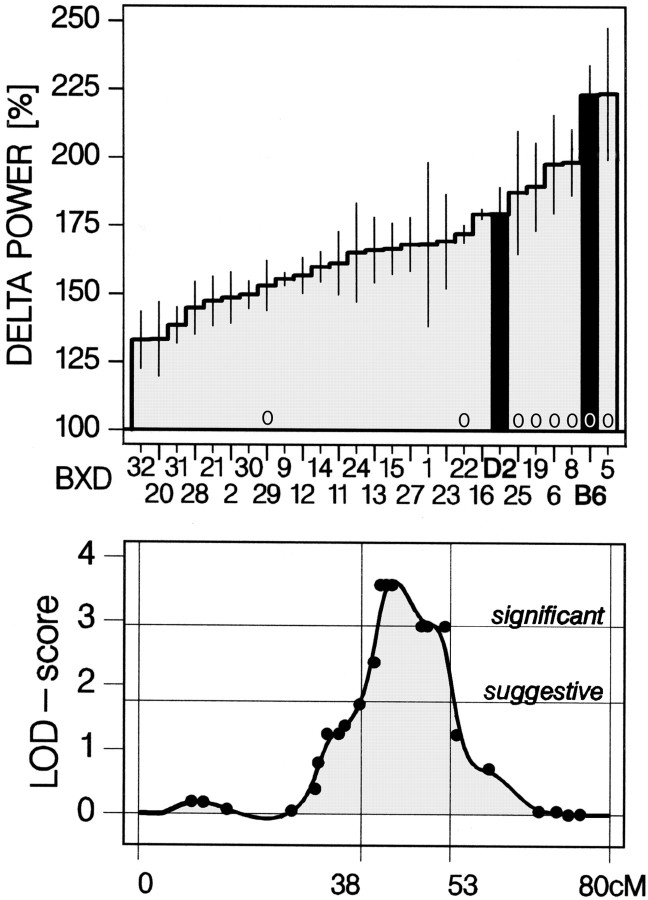
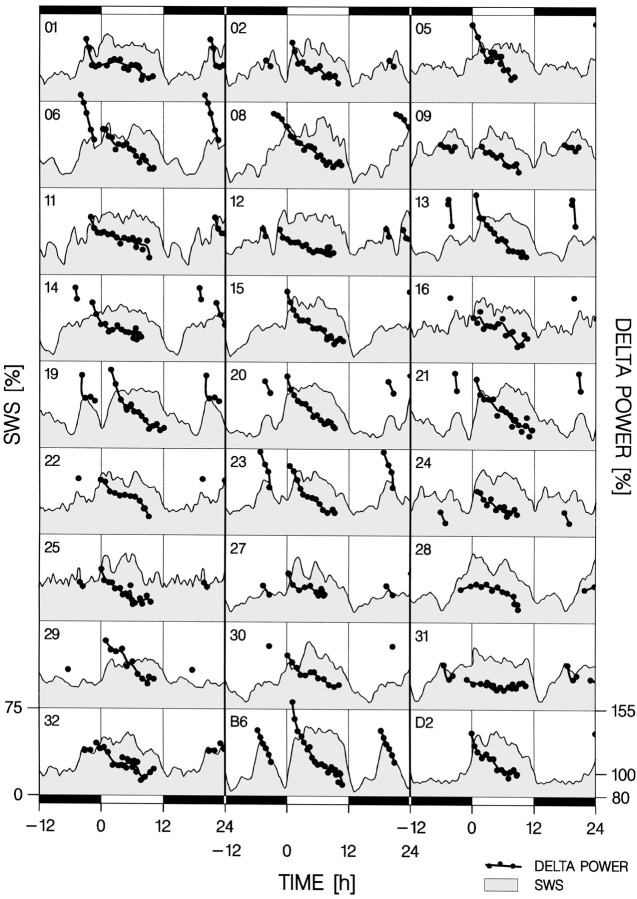
Delta power, a measure of EEG activity in the 1-4 Hz range, in slow-wave sleep (SWS) is in a quantitative and predictive relationship with prior wakefulness. Thus, sleep loss evokes a proportional increase in delta power, and excess sleep a decrease. Therefore, delta power is thought to reflect SWS need and its underlying homeostatically regulated recovery process. The neurophysiological substrate of this process is unknown and forward genetics might help elucidate the nature of what is depleted during wakefulness and recovered during SWS. We applied a mathematical method that quantifies the relationship between the sleep-wake distribution and delta power to sleep data of six inbred mouse strains. The results demonstrated that the rate at which SWS need accumulated varied greatly with genotype. This conclusion was confirmed in a "dose-response" study of sleep loss and changes in delta power; delta power strongly depended on both the duration of prior wakefulness and genotype. We followed the segregation of the rebound of delta power after sleep deprivation in 25 BXD recombinant inbred strains by quantitative trait loci (QTL) analysis. One "significant" QTL was identified on chromosome 13 that accounted for 49% of the genetic variance in this trait. Interestingly, the rate at which SWS need decreases did not vary with genotype in any of the 31 inbred strains studied. These results demonstrate, for the first time, that the increase of SWS need is under a strong genetic control, and they provide a basis for identifying genes underlying SWS homeostasis.


Figures

Fig. 1.
Fig. 1.
Illustration of the assumptions and parameter estimation of the simulation of Process S. a, The time course of S was calculated iteratively on the basis of the sequence of the 4 sec scores of the behavioral states wakefulness (W), slow-wave sleep (SWS), and paradoxical sleep (PS) and was assumed to increase during W and PS and to decrease during SWS, according to Equations 1and 2 (see Materials and Methods), respectively. S varies between an upper (UA) and lower asymptote (LA;dashed lines). b, These asymptotes were derived from the relative frequency distribution of delta power for 4 sec epochs scored as PS or SWS during the 48 hr recording. The 99% level of the SWS distribution (gray area) was chosen as the UA; the intercept of the PS and SWS distributions was chosen as the LA. c, As the initial S value (S0) at light onset of the baseline day, the value ofS obtained at the end of the baseline dark period (black horizontal bar on top) was used. This value was not affected by the values with which the iteration started, illustrated by starting at either the UA (curve 1) or the LA (curve 2). Curve 3starts at the S0 used in the final simulation for this mouse.Black bars at the bottom mark SWS episodes during which S decreases. d, Contour plot of the mean square of differences (DIF2) between simulated and empirical data as a function of the time constants for the increase (Ti) and the decrease (Td) of Process S. Numbers that label the contour lines indicate the number of times the DIF2 was larger than the least DIF2 (i.e., 44 μV4) obtained at Ti = 6.9 and Td = 1.5 hr.e, Final simulation of Process S (solid line) for one individual mouse of the C strain. The estimation of the parameters for this animal is illustrated inbd. Process S was fitted to the absolute median values of delta power (gray circles) reached in SWS episodes of >5 min. Dark horizontal bars on top indicate the 12 hr dark periods.
Fig. 2.
Fig. 2.
Mean time course over 48 hr of empirical and simulated delta power for six inbred strains of mice in baseline (BSL) and recovery (REC) from a 6 hr sleep deprivation (SD). Black dotsindicate mean (±SEM) delta power averaged over 45 min intervals (n = 4–7 per interval; see Materials and Methods).Gray areas delimit the mean ± SEM range for the simulated Process S for consecutive 15 min intervals. Forty-five minute intervals for which delta power and S significantly differed are indicated by gray bars underneath the curves of each strain (paired t tests; p < 0.05).Black horizontal bars mark the dark periods. Data for the BSL dark period are plotted twice to illustrate the dark-to-light transition. Delta power and S values are both expressed as a percentage of the mean SWS delta power in the last 4 hr of the BSL light period.
Fig. 3.
Fig. 3.
The relationship between waking duration and delta power. Left panel, The SD dose–response curve. The response in delta power (mean ± SEM; n = 6 per dose except 6 hr SD; n = 7) varied with SD dose and genotype [two-way ANOVA factors strain and dose:p < 0.0001; interaction: p = 0.0004; Tukey's range test: AK: 6 hr >9 hr >140 min >70 min = 35 min (day 4) = 35 min (day 9); D2: 6 hr = 9 hr >140 min = 35 min (day 4) = 70 min = 35 min (day 9);p < 0.05]. Delta power was higher in AK than in D2 mice for the 140 min (p = 0. 02) and 6 hr SD (p = 0.001; indicated by the gray stars). After the 9 hr SD, values tended to be higher (p = 0.09, t tests). The relationship between SD duration and delta power appeared linear for SDs of <9 hr (thinner lines; linear regression: AK: delta power = 24.6%/hr · SD duration + 92%; D2: delta power = 12.6%/hr · SD duration + 106%; p< 0.0001; r2 = 0.94 for both strains). Right panel, Relationship between the duration of spontaneous waking bouts and delta power in the last 4 hr of the three baseline light periods. The duration determines the level of delta power in subsequent SWS (two-way ANOVA factor strain:p = 0.7; factor “category”:p < 0.0001; interaction: p = 0.5; Tukey's range test for both AK and D2: <12 min = 12–25 min < 12–25 min = >24 min; p < 0.05,n = 6 per category per strain; see Materials and Methods for details). This relationship was quantified by linear regression (AK: delta power = 26.4%/hr · W duration + 93%;p = 0.003;r2 = 0.41; D2: delta power = 16.2%/hr · W duration + 95%; p = 0.0009;r2 = 0.53; n= 6 per category per strain). For both panels the solid black lines connect mean values for AK mice (black dots); dashed lines connect values for D2 mice (gray squares). Values represent the mean delta power in the first 225 (left panel) or 75–225 (right panel) 4 sec epochs scored as SWS after the end of wakefulness. Although scaling differed between panels, the delta power/waking time ratio is preserved, allowing slope comparisons.
Fig. 4.
Fig. 4.
The amount of SWS and time course of Process S during the SDs. Top panel, Hourly values (mean ± SEM; n = 6 per hour per strain) for the accumulation of the amount of SWS during the 9 hr SD. Attempts to enter SWS increase as the SD progresses and result in a doubling in SWS time in the last 3 hr. SWS did not differ between strains at any of the time points (two-way ANOVA factor strain: p = 0.6; factor 1 hr interval: p < 0.0001; interaction:p = 1.0). Symbols are as in Figure 3. Thesix gray diamonds represent mean SWS values for both strains accumulated over the shorter SDs used in the dose–response curve. Genotype did not affect these values (two-way ANOVA factor strain: p = 0.9; factor dose: p< 0.0001; interaction: p = 0.9). Bottom panel, SWS expressed during the SD can explain the lower delta power values reached after the 9 hr as compared with the 6 hr SD. With the assumptions and the parameters of the simulation analyses (Table1), Process S can be followed through the 6 and 9 hr SDs. Delta power (filled black symbols:circles, AK, squares, D2; mean ± SEM) after the 6 (n = 7) and 9 hr (n = 6) SD can be predicted remarkably well (simulated values of S: open symbols; mean ± SEM). Delta power values are indicated at time + 0.1 hr to avoid overlap of error bars.
Fig. 5.
Fig. 5.
The decrease in SWS delta power during recovery depends on its initial level. Left panel, As in Figure 3but now for each SD, both the mean delta power in the initial 15 min of SWS (d1) and the last 15 min of SWS of the first 1.1 hr after the SD (d2) are plotted (mean ± SEM; n = 6 per strain, except for 6 hr SD;n = 7). Right panel, Individual combinations of the delta power decrease (d1d2) and initial delta power (d1). Linear regression analysis demonstrated that the decrease strongly depended ond1 for both strains [AK: (d1d2) = 0.47 ·d1 − 48;r2 = 0.89; p< 0.0001; D2: (d1d2) = 0.49 ·d1 − 50;r2 = 0.87; p< 0.0001; n = 37 per strain]. These linear relationships define exponential functions with time constants of 1.3 ± 0.1 hr for AK (n = 32) and 1.1 ± 0.1 hr for D2 (n = 36; p = 0.2;t test; see Materials and Methods). Symbols are as in Figure 3.
Fig. 6.
Fig. 6.
Decrease in SWS delta power during the first 6 hr of recovery sleep after a 6 hr SD. Delta power data (mean ± SEM;n = 7 per strain) are taken from experiment 1. Each value represents the mean over consecutive 225 4 sec epochs scored as SWS and is plotted at the mean time after recovery sleep onset.Stars at the bottom indicate significant strain differences in delta power (t tests;p < 0.05). The two pairs of lines delineate the average results (±1 SEM) of the individually performed nonlinear regression analyses assuming an exponential decrease with time in delta power. The function is determined by the time constant (τd; p = 0.8), the initial value at recovery sleep onset (S0;p < 0.0001), and the asymptote (LA;p = 0.6; t tests AK vs D2;n = 7 per strain; values in Table 4). Symbols are as in Figure 3.
Fig. 7.
Fig. 7.
QTL analysis of the delta power rebound after 6 hr sleep deprivation in BXD-RI mice. Top panel, SDP of delta power in the first 15 min of SWS (mean ± SEM;n = 4–7 per strain) after the sleep deprivation.Black vertical bars mark progenitor strains B6 and D2.Zeros above the horizontal axis denote strains carrying the B6 allele (as opposed to a D2 allele) at the markers that gave the best LOD score on chromosome 13. Bottom panel, Point correlations between the SDP of the phenotype (i.e., delta power) and the genotype of the MIT markers on chromosome 13. p values of the correlations are converted into LOD scores. The genome-wide suggestive and significant levels are derived from an empirical probability distribution (see Materials and Methods). The positions of the markers are given in cM from centromere according to the MGI database (www.informatics.jax.org). The 38–53 cM range indicates the interval where the interpolated LOD scores > suggestive, roughly corresponding to a ±2 LOD score confidence interval.
Fig. 8.
Fig. 8.
Distribution of SWS in baseline and the time course of SWS delta power during the main sleep periods of the 25 BXD-RI strains tested. The SWS distribution (gray area) represents a 2 hr moving average of percentage recording time with a 15 min resolution (4–7 per strain). Delta power values (black dots connected with thick lines) represent means over consecutive 225 4 sec epochs scored as SWS. Only delta power values for SWS occurring within the main sleep period(s) are depicted. One to two major sleep periods were determined per mouse according to the SWS distribution (see Materials and Methods). The initial delta power values of these sleep periods were used in the QTL analysis. The number in the top right-hand corner of each panel indicates the BXD-RI strain ID. The progenitor strains, B6 and D2, are indicated on the bottom row. Data in the dark period are displayed twice to visualize the dark-to-light transition.

References

    1. Achermann P, Dijk DJ, Brunner DP, Borbély AA. A model of human sleep homeostasis based on EEG slow-wave activity: quantitative comparison of data and simulations. Brain Res Bull. 1993;31:97–113. - PubMed
    1. Aeschbach D, Cajochen C, Landolt H, Borbély AA. Homeostatic sleep regulation in habitual short sleepers and long sleepers. Am J Physiol. 1996;270:R41–53. - PubMed
    1. Aeschbach D, Matthews JR, Postolache TT, Jackson MA, Giesen HA, Wehr TA. Two circadian rhythms in the human electroencephalogram during wakefulness. Am J Physiol. 1999;277:R1771–1779. - PubMed
    1. Anokhin A, Steinlein O, Fischer C, Mao Y, Vogt P, Schalt E, Vogel F. A genetic study of the human low-voltage electroencephalogram. Hum Genet. 1992;90:99–112. - PubMed
    1. Beijsterveldt CEM, Boomsma DI. Genetics of the human electroencephalogram (EEG) and event-related brain potentials (ERPs): a review. Hum Genet. 1994;94:319–330. - PubMed

Publication types

LinkOut - more resources