

Unitary synaptic currents between lacunosum-moleculare interneurones and pyramidal cells in rat hippocampus
- PMID: 11306657
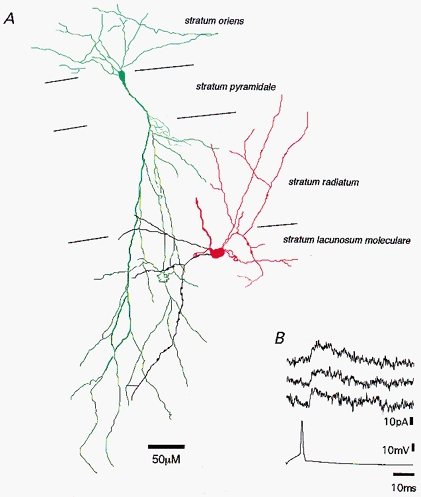
- PMCID: PMC2278545
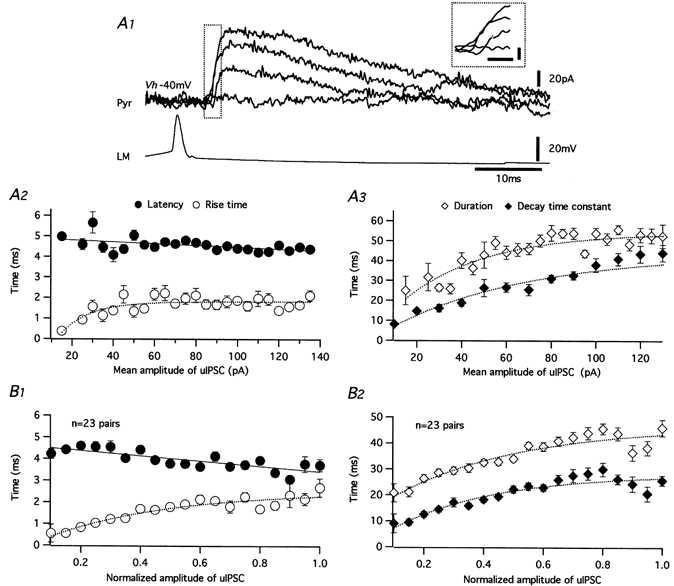
- DOI: 10.1111/j.1469-7793.2001.0369f.x
Unitary synaptic currents between lacunosum-moleculare interneurones and pyramidal cells in rat hippocampus
Abstract
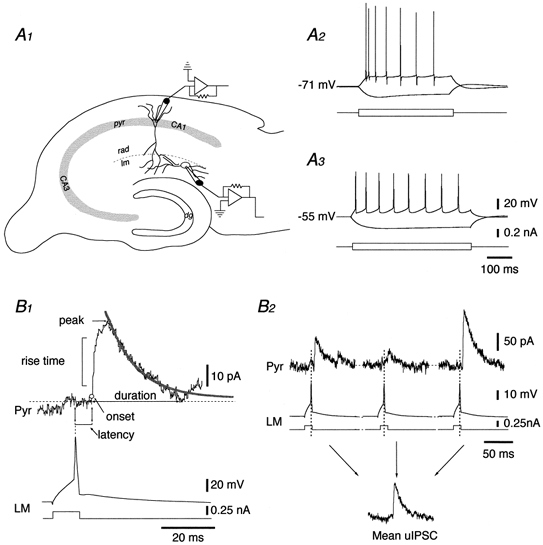
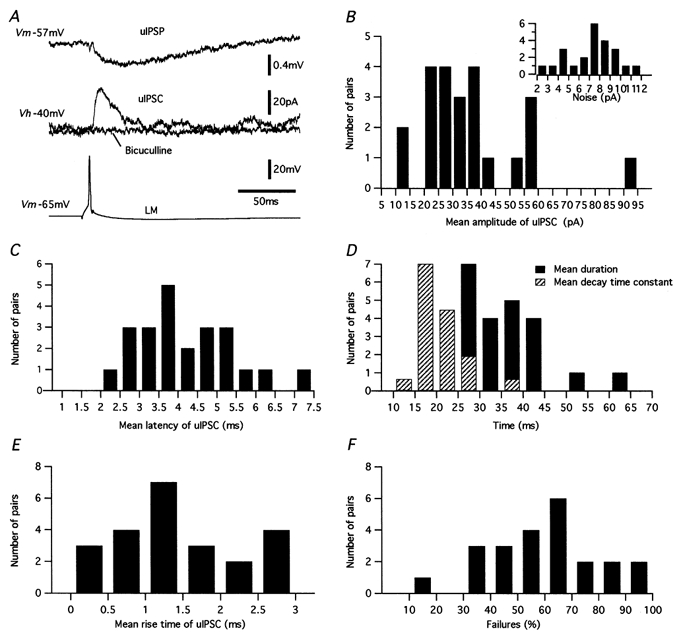
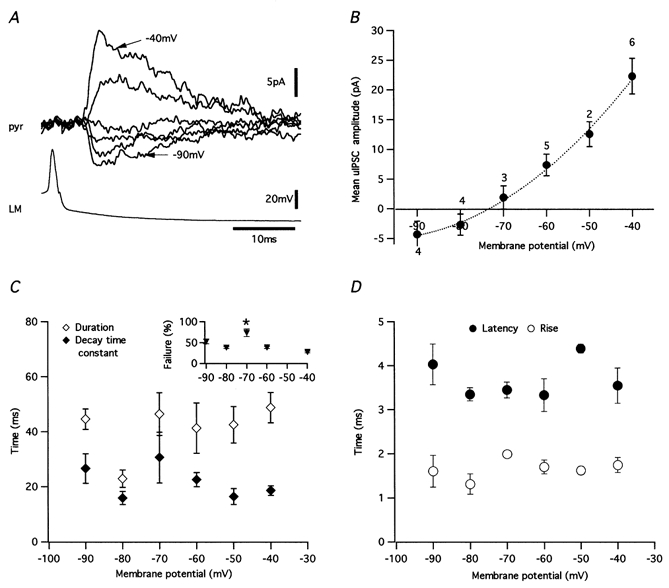
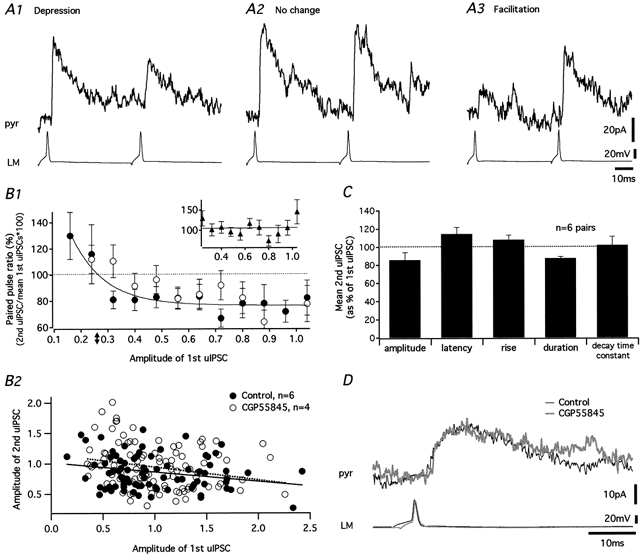
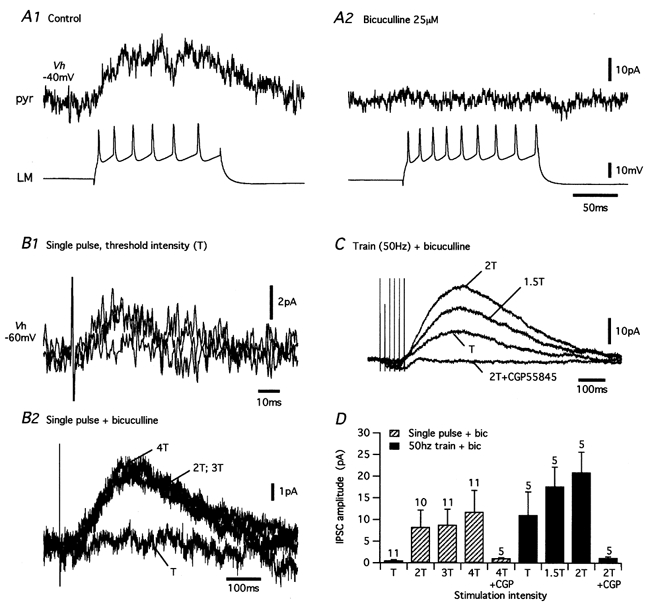
1. Unitary inhibitory postsynaptic currents (uIPSCs) were characterised between 23 synaptically coupled interneurones at the border of stratum radiatum and lacunosum-moleculare (LM) and CA1 pyramidal cells (PYR) using dual whole-cell recordings and morphological identification in rat hippocampal slices. 2. LM interneurones presented a morphology typical of stellate cells, with a fusiform soma as well as dendritic and axonal arborisations in stratum radiatum and lacunosum-moleculare. 3. Single spikes in interneurones triggered uIPSCs in pyramidal cells that were blocked by the GABA(A) antagonist bicuculline and mediated by a chloride conductance. The latency, rise time, duration and decay time constant of uIPSCs were a function of amplitude in all pairs, suggesting a homogeneity in the population sampled. 4. During paired pulse stimulation, individual LM-PYR connections exhibited facilitation or depression. The paired pulse ratio was inversely related to the amplitude of the first response. The transition from facilitation to depression occurred at 26 % of the maximal amplitude of the first uIPSC. Paired pulse depression was not modified by CGP 55845 and thus was GABA(B) receptor independent. 5. CGP 55845 failed to modify the amplitude of uIPSCs, suggesting an absence of tonic presynaptic GABA(B) inhibition at LM-PYR connections. 6. Increasing GABA release by repetitive activation of interneurones failed to induce GABA(B) IPSCs. With extracellular minimal stimulation, increasing stimulation intensity above threshold, or repetitive activation, evoked GABA(B) IPSCs, probably as a result of coactivation of several GABAergic fibres. 7. Thus, dendritic inhibition by LM interneurones involves GABA(A) uIPSCs with kinetics dependent on response amplitude and subject to GABA(B)-independent paired pulse plasticity.
Figures
References
-
- Andreasen M, Hablitz JJ. Paired pulse facilitation in the dentate gyrus: a patch-clamp study in rat hippocampus in vitro. Journal of Neurophysiology. 1994;72:326–336. - PubMed
-
- Buhl EH, Halasy K, Somogyi P. Diverse sources of hippocampal unitary inhibitory postsynaptic potentials and the number of synaptic release sites. Nature. 1994a;368:823–828. - PubMed
-
- Buhl EH, Han ZS, Lorincki Z, Steshka VV, Karnup SV, Somogyi P. Physiological properties of anatomically identified axo-axonic cells in the rat hippocampus. Journal of Neurophysiology. 1994b;71:1289–1307. - PubMed
Publication types
MeSH terms
Substances
LinkOut - more resources
Full Text Sources
Miscellaneous