Comparative Study
. 2001 Apr 15;532(Pt 2):385-97.
doi: 10.1111/j.1469-7793.2001.0385f.x.

Slow recovery from inactivation regulates the availability of voltage-dependent Na(+) channels in hippocampal granule cells, hilar neurons and basket cells

Affiliations
Comparative Study

Slow recovery from inactivation regulates the availability of voltage-dependent Na(+) channels in hippocampal granule cells, hilar neurons and basket cells

R K Ellerkmann et al. J Physiol. .

Erratum in

  • J Physiol 2001 Jun 15;533 Pt 3:921

Abstract

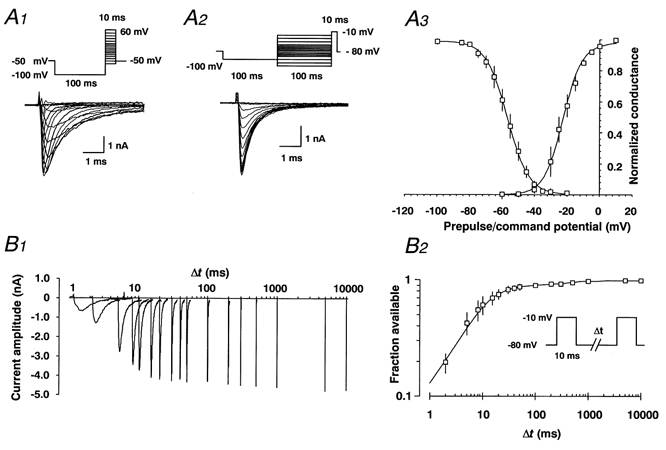
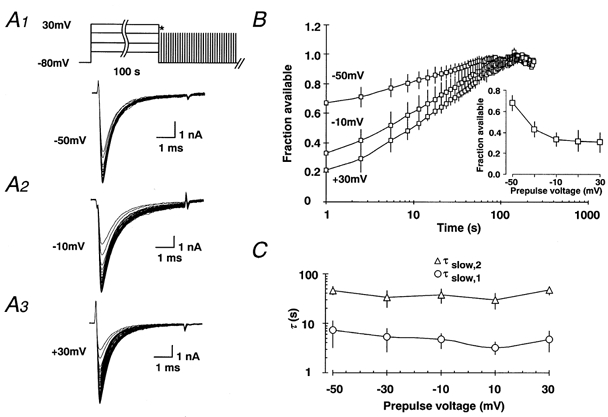
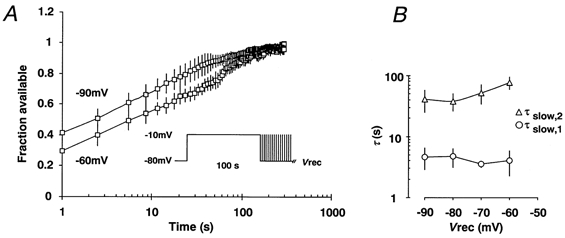
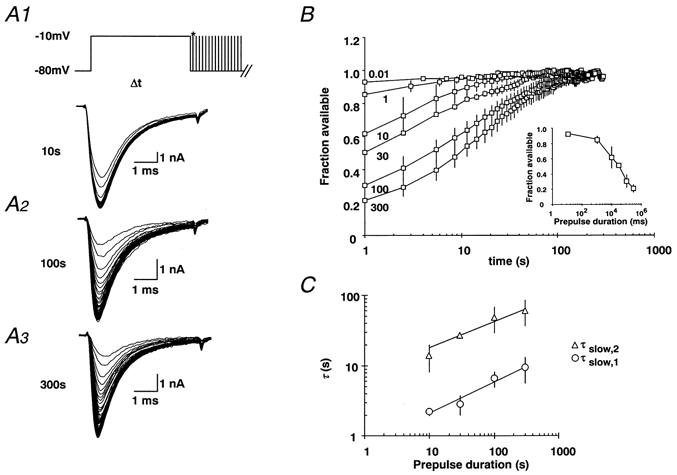
1. Fundamental to the understanding of CNS function is the question of how individual neurons integrate multiple synaptic inputs into an output consisting of a sequence of action potentials carrying information coded as spike frequency. The availability for activation of neuronal Na(+) channels is critical for this process and is regulated both by fast and slow inactivation processes. Here, we have investigated slow inactivation processes in detail in hippocampal neurons. 2. Slow inactivation was induced by prolonged (10-300 s) step depolarisations to -10 mV at room temperature. In isolated hippocampal dentate granule cells (DGCs), recovery from this inactivation was biexponential, with time constants for the two phases of slow inactivation tau(slow,1) and tau(slow,2) ranging from 1 to 10 s and 20 to 50 s, respectively. Both (slow,1) and tau(slow,2) were related to the duration of prior depolarisation by a power law function of the form tau(t) = a (t/a)b, where t is the duration of the depolarisation, a is a constant kinetic setpoint and b is a scaling power. This analysis yielded values of a = 0.034 s and b = 0.62 for tau(slow,1) and a = 24 s and b = 0.30 for tau(slow,2) in the rat. 3. When a train of action potential-like depolarisations of different frequencies (50, 100, 200 Hz) was used to induce inactivation, a similar relationship was found between the frequency of depolarisation and both tau(slow,1) and tau(slow,2) (a = 0.58 s, b = 0.39 for tau(slow,1) and a = 3.77 s and b = 0.42 for tau(slow,2)). 4. Using nucleated patches from rat hippocampal slices, we have addressed possible cell specific differences in slow inactivation. In fast-spiking basket cells a similar scaling relationship can be found (a = 3.54 s and b = 0.39) as in nucleated patches from DGCs (a = 2.3 s and b = 0.48) and non-fast-spiking hilar neurons (a = 2.57 s and b = 0.49). 5. Likewise, comparison of human and rat granule cells showed that properties of ultra-slow recovery from inactivation are conserved across species. In both species ultra-slow recovery was biexponential with both tau(slow,1) and tau(slow,2) being related to the duration of depolarisation t, with a = 0.63 s and b = 0.44 for tau(slow,1) and a = 25 s and b = 0.37 for tau(slow,2) for the human subject. 6. In summary, we describe in detail how the biophysical properties of Na(+) channels result in a complex interrelationship between availability of sodium channels and membrane potential or action potential frequency that may contribute to temporal integration on a time scale of seconds to minutes in different types of hippocampal neurons.


Figures

Figure 1
Figure 1. Fast voltage-dependent activation, inactivation and recovery from inactivation in rat DGCs
A1 andA2, families of representative recordings elicited by the voltage protocols shown in the insets. A3, average values of normalised conductances for voltage-dependent activation and inactivation are shown. For each individual recording, a Boltzmann function (eqn (2)) was fitted to the data points of voltage-dependent steady state activation or inactivation. Boltzmann functions constructed from the average values for half-maximal activation and inactivation and the slope factor k are shown superimposed on the data points in Fig. 1A 3 with V1/2,act= -22.6 ± 2.3 mV, k= 5.8 ± 0.7 mV, n= 5 and V1/2,inact= -56.8 ± 2.5 mV, k= -6.71 ± 0.32 mV, n= 7. In these recordings, the maximal residual voltage error due to the series resistance, RS,eff, calculated as Imax×RS,eff, did not exceed 6 mV (5.1 ± 1.7 mV). After reducing the current amplitude by ≈50 % via application of 5 nm tetrodotoxin to reduce RS,eff, the voltage dependence of fast activation remained unchanged (V1/2,act= -22.8 ± 2.5 mV, k= 7.5 ± 1.9 mV, n= 7; not shown). Likewise, voltage-dependent activation measured in DGC nucleated patches yielded similar values (V1/2,act= -25.2 ± 3.5 mV, k= 7.5 ± 0.8 mV, n= 4), indicating that the error in voltage dependence due to RS,eff is negligible. B 1, fast recovery from inactivation was analysed with double-pulse experiments at a recovery potential of -80 mV, with various intervals between a 10 ms conditioning pulse (-10 mV) used to induce inactivation, and a 10 ms test pulse (B 2, inset). Representative family of original traces are displayed on an exponential time scale (B 1). B 2, recovery from fast inactivation could be best described by the biexponential equation (eqn (3)) shown superimposed on the data points in B 2 with τfast,1= 9.3 ± 2.5 ms; τfast,2= 412.4 ± 112.4 ms; n= 7. A2, peak currents elicited after each interpulse interval were normalised to the peak test pulse current obtained after a recovery period of 10 s at -80 mV. To ensure that the peak current reflected the complete recovery of Na+ currents, all cells were clamped to -80 mV for 0.5 min after the double-pulse experiment. Experiments in which a further increase or decrease in Na+ current amplitude of more than 5 % could be observed during this 0.5 min interval were excluded from further analysis. The time constants obtained with partial blockade of Na+ channels in the presence of 5 nm TTX were not significantly different (not shown).
Figure 2
Figure 2. The time course of slow recovery depends on the duration of prior depolarisation in rat DGCs
A1-3, a conditioning pulse to -10 mV was applied for various durations (10, 100 or 300 s). The time course of ultra-slow recovery from inactivation was monitored by a series of brief test pulses with a frequency of 0.33 Hz until the Na+ current amplitude reached saturation (Imax). B, because rapid recovery from inactivation should be virtually complete after a 1 s interval at -80 mV (see asterisk in the pulse protocol), the remaining inactivation is a good measure of the relative proportion of slow recovery processes. Prepulses ranging from 10 ms to 300 s in duration were used to induce Na+ channel inactivation. The current amplitude during recovery of the Na+ current was normalised to Imax, yielding the fraction of available Na+ current. The normalised values were plotted over recovery time for various prepulse durations (0.01, 1, 10, 30, 100 and 300 s with n= 5-7). The inset shows the fraction of Na+ channels showing slow recovery which increases steeply with increasing prepulse duration in rat DGCs. The fraction of available Na+ currents was calculated as the ratio of peak current during the first test pulse divided by Imax (eqn (4)). C, with prepulse durations from 10-300 s, the recovery from inactivation was fitted by a biexponential function (eqn (3)), with the two time constants τslow,1 (○) and τslow,2 (△) n = 5-7. The relationship between the duration of prior depolarisation t and recovery time constants τ was fitted by a power law function of the form: τ(t) =a (t /a)b with a= 0.03 s and b= 0.62 for τslow,1 and a= 24 s and b= 0.30 for τslow,2 (see Table 1) shown superimposed on the data points. Time constants (□) extracted from double-pulse experiments with conditioning prepulse durations of 10, 100, 1000 ms, with n= 3, 4 and 6, respectively.
Figure 3
Figure 3. The time course of ultra-slow recovery does not depend on the voltage of the conditioning depolarisation
A1-3, inactivation was induced with a 100 s depolarising prepulse to various potentials (-50 to +30 mV) in order to investigate the voltage dependence of entry into slow inactivation. B, as in Fig. 2, the fraction of available current slowly recovered. The inset shows the fraction of available Na+ current which was calculated as described in eqn (4) and plotted against the prepulse voltage. C, the recovery from inactivation was fitted by a biexponential function (eqn (3)), with the two time constants τslow,1 (○) and τslow,2 (△, n= 5-12). The time constants were plotted against the prepulse voltage used to induce inactivation.
Figure 4
Figure 4. Voltage dependence of the recovery process in rat DGCs
A, slow recovery induced by a 100 s depolarising prepulse to -10 mV (see inset) was investigated at various recovery potentials (Vrec) ranging from -90 to -60 mV. B, the recovery from inactivation was fitted by a biexponential function (eqn (3)), with the two time constants τslow,1 (○) and τslow,2 (△) n = 5-7 which were plotted against the recovery potential Vrec.
Figure 5
Figure 5. Action potential-like depolarisations also induce entry into the slowly recovering state in rat DGCs
A, inactivation was induced with a 100 s train of short depolarisations (2 ms, 30 mV) at different frequencies (50, 100 and 200 Hz). Recovery from inactivation was monitored as in Fig. 2. B, the recovery from inactivation was fitted by a biexponential function, with the two time constants slow,1 (○) and τslow,2 (△) (n= 4,7 and 7, respectively). The relationship between the stimulation frequency f and the recovery time constants τ was fitted by a power law function of the form: τ(f) =a (fa)b with a= 0.58 s and b= 0.39 for τslow,1 and a= 3.77 s and b= 0.42 for τslow,2 (see Table 1) shown superimposed on the data points.
Figure 6
Figure 6. Ultra-slow recovery of rat Na+ channels in nucleated patches from granule cells, hilar neurons and basket cells
A1-3, whole-cell current clamp recordings from a representative DGC (A1), hilar neuron (A2) and basket cell (A3) in rats. B 1-3, nucleated patch recordings from a representative DGC (B 1), hilar neuron (B 2) and basket cell (B 3) in rats. C, fraction of available Na+ current as a function of prepulse duration in DGCs (□), hilar neurons (△) and basket cells (○). D, because Na+ currents recorded in nucleated patches showed some decrease in amplitude over prolonged time periods, τslow,2 could not easily be evaluated. Fitting of the recovery process was therefore performed with only one exponential corresponding to the faster time constant, τslow,1. The time constant τslow,1 was then plotted against the duration of the conditioning prepulse for all 3 cell types (n= 5 for all data points). As in whole-cell recordings, this relationship was well described by the power law function τ(t) =a (t /a)b with a= 2.3 s and b= 0.48 for DGCs, a= 2.57 s and b= 0.49 for hilar neurons and a= 3.54 s and b= 0.39 for basket cells shown superimposed on the data points.
Figure 7
Figure 7. Ultra-slow recovery from inactivation of Na+ channels in human DGCs
A1-A3, a conditioning pulse to -10 mV was applied for various durations (10, 100 or 300 s), as in Fig. 2. The time course of ultra-slow recovery from inactivation was monitored by a series of brief test pulses with a frequency of 0.33 Hz until the Na+ current amplitude reached saturation (Imax). B, the current amplitude during recovery of the Na+ current was normalised to Imax, yielding the fraction of available Na+ current. The normalised values were plotted against recovery time for various prepulse durations (0.01, 1, 10, 30, 100 and 300 s with n= 3, 4, 4, 2, 3 and 3, respectively). The fraction of available Na+ currents was calculated as the ratio of peak current during the first test pulse divided by Imax. As in rat DGCs, the fraction of Na+ channels showing slow recovery increases steeply with prepulse duration. C, with prepulse durations from 10-300 s, the recovery from inactivation was fitted by a biexponential function, with the two time constants τslow,1 (○) and τslow,2 (△). The relationship between the duration of prior depolarisation t and recovery time constants τ was fitted by a power law function of the form: τ(t) =a (t/a)b with a= 0.63 s and b= 0.44 for τslow,1 and a= 25 s and b= 0.37 for τslow,2 (see Table 1) shown superimposed on the data points.

References

    1. Barry PH, Lynch JW. Liquid junction potentials and small cell effects in patch-clamp analysis. Journal of Membrane Biology. 1991;121:101–117. - PubMed
    1. Black JA, Yokoyama S, Higashida H, Ransom BR, Waxman SG. Sodium channel mRNAs I, II and III in the CNS: cell-specific expression. Molecular Brain Research. 1994;22:275–289. - PubMed
    1. Bragin A, Penttonen M, Buzsaki G. Termination of epileptic afterdischarge in the hippocampus. Journal of Neuroscience. 1997;17:2567–2579. - PMC - PubMed
    1. Catterall WA. Cellular and molecular biology of voltage-gated sodium channels. Physiological Reviews. 1992;72(suppl.):15–48S. - PubMed
    1. Colbert CM, Johnston D. Axonal action-potential inititation and Na+ channel densitites in the soma and axon initial segment of subicular pyramidal neurons. Journal of Neuroscience. 1996;16:6676–6686. - PMC - PubMed

Publication types

Substances

LinkOut - more resources